

どんな記事
Python でテクニカル分析ができるライブラリ「TA-Lib」を、Google Colabで使用する方法の備忘録。pandas_datareaderで価格データを取得、TA-Libでテクニカル分析をして、Plotlyでローソク足のチャートを出力する手順。
Twitterでも紹介していただいています
必要なモジュールのインストールと読み込み
TA-Libのインストール
まず、「TA-Lib」をダウンロードしてtarファイルを解凍。
!curl -L http://prdownloads.sourceforge.net/ta-lib/ta-lib-0.4.0-src.tar.gz -O && tar xzvf ta-lib-0.4.0-src.tar.gz&&で複数の処理をつなげて記述している。curl -L http://~~ -Oでファイルをダウンロード。tar xzvf ta-lib-0.4.0-src.tar.gzでダウンロードしたtarファイルを解凍。
次に、ライブラリをインスールする。
!cd ta-lib && ./configure --prefix=/usr && make && make install && cd - && pip install ta-libcd ta-libでディレクトリの移動。
./configure --prefix=/usr``make``make installはインストール作業。詳細は以下のリンクを参照。
cd -で元のディレクトリに戻って、pip install ta-libで Python にインストール。
インストール作業については、以下のページを参考に。
Plotlyのアップデート
Plotlyのアップデートは次のコードを実行するだけ。この一連のコードを試したときのバージョンはplotly-3.5.0。
!pip install plotly --upgrade必要なモジュールの読み込み
使用するモジュールをすべて読みこんでおく。enable_plotly_in_cell()は、Google Colabのセルで Plotlyを表示するのに必要な関数。グラフを出力するときに使用する。
import pandas as pd
import pandas_datareader.data as web
import numpy as np
import talib as ta
import plotly
import plotly.graph_objs as go
import plotly.figure_factory as ff
plotly.offline.init_notebook_mode( connected=True )

# google colabでplotlyを表示するにはこれが必要。
# グラフを書き出すセルごとに使用する
def enable_plotly_in_cell():
    import IPython
    from plotly.offline import init_notebook_mode
    display(IPython.core.display.HTML('''
            <script src="/static/components/requirejs/require.js"></script>
    '''))
    init_notebook_mode( connected=False )
データの取得
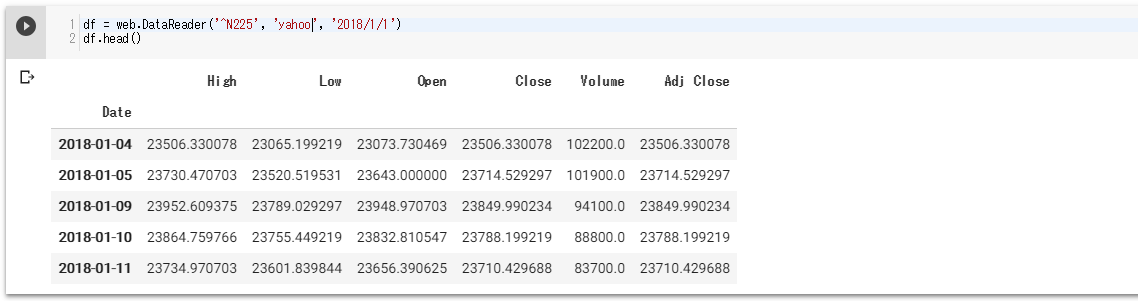
テスト用のデータは、yahoo(米国)の日経平均を使用する。
# データを取得
df = web.DataReader('^N225', 'yahoo', '2018/1/1')

# 出力して確認
df.head()
出力結果は以下のようになる。
TA-Libでテクニカル分析の算出
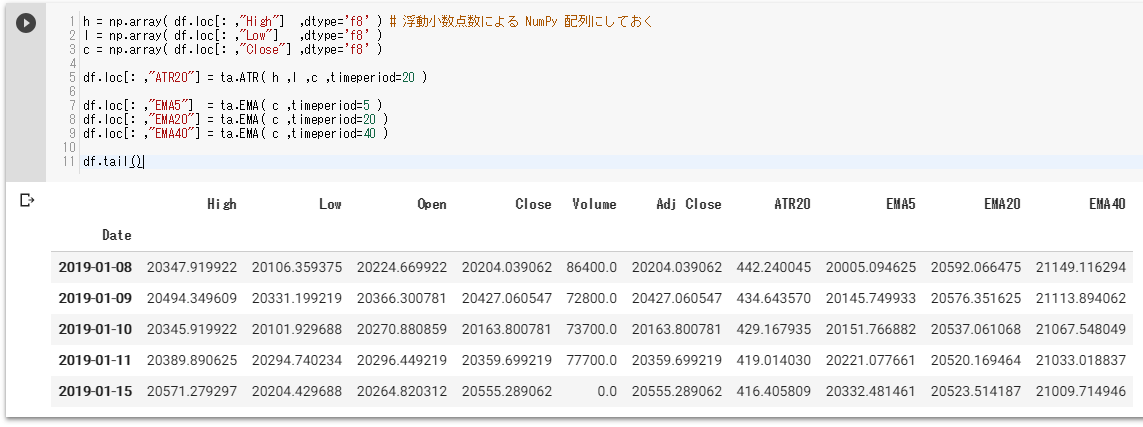
3つの移動平均線とATRを算出してみる。
# 計算用に numpy の配列を作成する
h = np.array( df.loc[: ,"High"]  ,dtype='f8' )
l = np.array( df.loc[: ,"Low"]   ,dtype='f8' )
c = np.array( df.loc[: ,"Close"] ,dtype='f8' )

df.loc[: ,"ATR20"] = ta.ATR( h ,l ,c ,timeperiod=20 )

df.loc[: ,"EMA5"]  = ta.EMA( c ,timeperiod=5 )
df.loc[: ,"EMA20"] = ta.EMA( c ,timeperiod=20 )
df.loc[: ,"EMA40"] = ta.EMA( c ,timeperiod=40 )

# 出力して確認
df.tail()
算出結果は以下。
Plotlyでグラフを出力して確認する
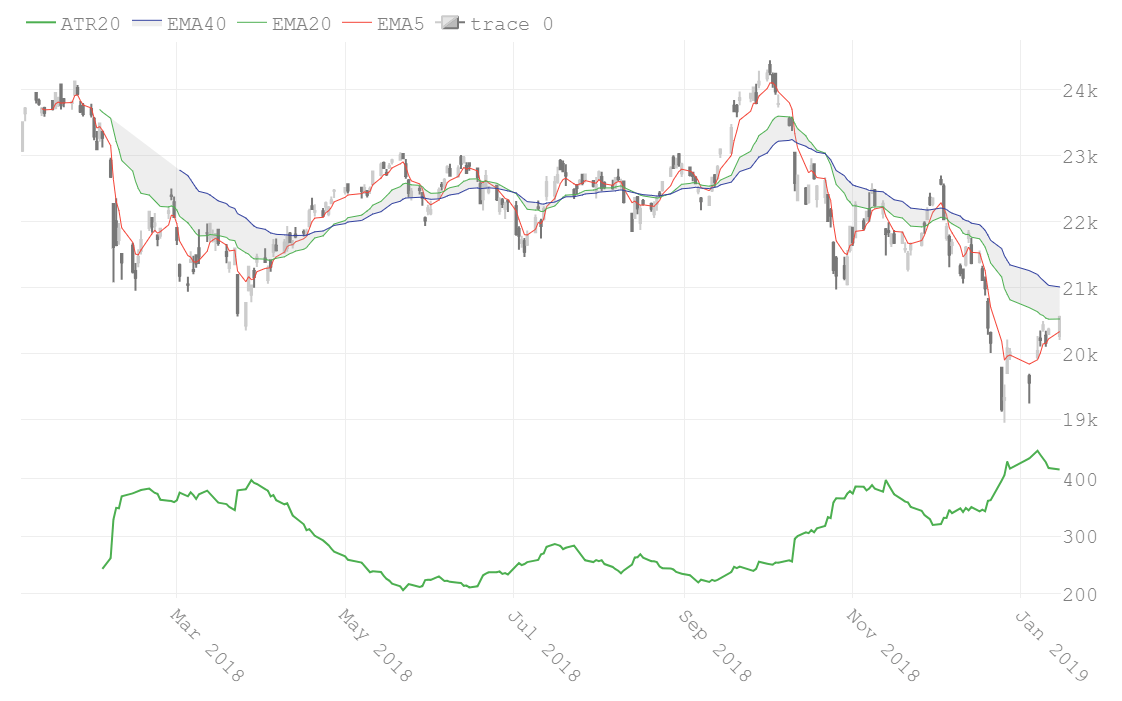
最後に、Plotlyでローソク足を出力して、何となく視覚的に確認してみる。
layout = dict(
     autosize = False
    ,legend   = dict( xanchor="left" ,y=1.01 ,orientation="h")
    ,width    = 950
    ,height   = 800
    ,xaxis    = dict( title="" ,type="date" ,showgrid=True ,tickangle=45 ,anchor="y1" ,rangeslider=dict(visible=False) )
    ,yaxis    = dict( domain=[.05 ,.3] ,title="" ,side="right" )
    ,yaxis2   = dict( domain=[.3 ,.95] ,title="" ,side="right" )
    ,font     = dict( family='Courier New, monospace' ,size=20 ,color='#7f7f7f' ) )

trace = go.Candlestick(
     x     = df.index
    ,open  = df['Open']
    ,high  = df['High']
    ,low   = df['Low']
    ,close = df['Close']
    ,yaxis = 'y2'
    ,increasing = dict( line=dict(color='#CCCCCC') )
    ,decreasing = dict( line=dict(color='#777777') ) )

fig = dict( data=[trace] ,layout=layout )

fig['data'].extend([
     go.Scatter( yaxis="y2" ,x=df.index ,y=df["EMA5"]  ,name= 'EMA5'  ,line=dict(color='#F44336' ,width=1) )
    ,go.Scatter( yaxis="y2" ,x=df.index ,y=df["EMA20"] ,name= 'EMA20' ,line=dict(color='#4CAF50' ,width=1) )
    ,go.Scatter( yaxis="y2" ,x=df.index ,y=df["EMA40"] ,name= 'EMA40' ,line=dict(color='#303F9F' ,width=1) ,fill="tonexty" ,fillcolor="rgba(170,170,170,.2)" )
    ,go.Scatter( yaxis="y1" ,x=df.index ,y=df["ATR20"] ,name= 'ATR20' ,line=dict(color='#4CAF50' ,width=2) ) ])

# Google Colab ではこれを実行しないと表示されない
enable_plotly_in_cell()

# グラフを描画
plotly.offline.iplot(fig)
以下のようなグラフになった。問題はなさそう。
参考にしたサイト
開発を承っています
- Pineスクリプト(インジケーターやストラテジー)
- Google Apps Script
- Python
- MQL4
などの開発を承っています。とくに投資関連が得意です。過去の事例は「実績ページ(不定期更新)」でご確認ください。ご相談は「お問い合わせ」からお願いします。


- 記事をシェア