

どんな記事
TradingView(トレーディングビュー)の Pineスクリプトでつくるインジケーターのメモです。どれもコピペで機能をつけ加えることができ�る簡単なものです。
今後も、思いついたものや見つけたものがあれば、どんどん加えていく予定です!
記事の更新
2023年11月13日
新しいサンプルの追加、既存のサンプルの一部を最適化、目次の整理を行いました。
2021年11月13日
「配列を使う」を追加し、いくつかの簡単なサンプルを削除しました。
2020年6月18日
「timezoneと夏時間の認識」の最適化を行いました。
2019年8月17日
timezone label lineに関するコードを追加しました。その他、version4の公開に伴い加筆修正を行いました。
2019年6月8日
「VWAPの累積平均を算出」を追加しました。
2019年5月4日
「チャート以外の価格データを取得」のコードを最新のものに更新、「Quandlから金融データを取得」を追加しました。
Pineスクリプトの優位性
数年前に比べると、Pineスクリプトでできることが格段に増えています。
最高なのは、四本値以外のあらゆるデータが取得できること。銘柄やタイムフレーム、データの壁がどんどんなくなっています。そして、それをどんどん自由に表現できるようになっています。
MQLやPythonがまだ優位なのは、次のような点なのかなと思います。
- 計算速度
- Seriesデータの閲覧性(※)
- 機械学習
- 統計処理
時間に関するもの
Pineスクリプトは時系列について非常に厳格です。リペイント等で誤解が生じにくくなるように設計されていると思います。
時系列を自由に進んだり戻ったりできないことは一見するとデメリットですが、誤解の少ないインジケーターやストラテジーをつくりやすいというメリットもあります。
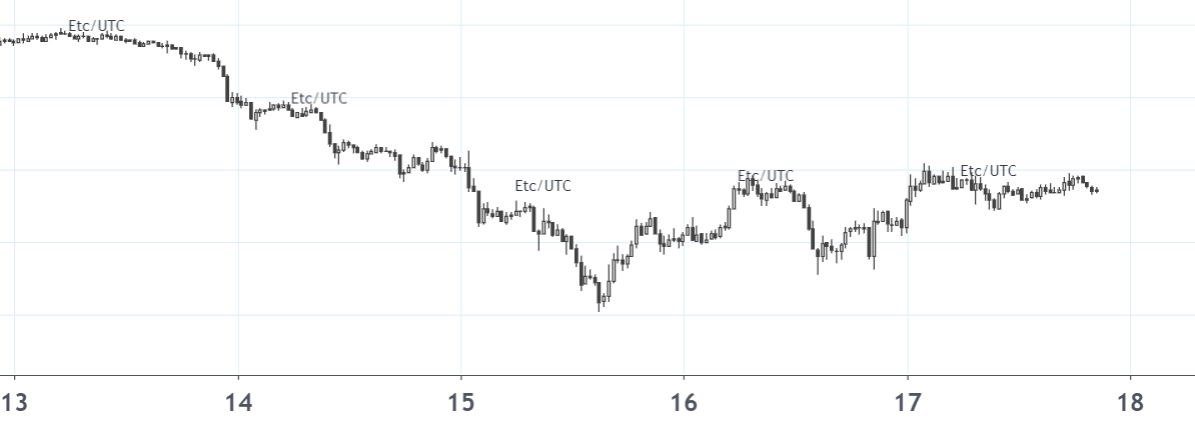
タイムゾーンを指定して、正確な時刻の判定
タイムゾーンと時刻から、対象のローソク足にタテ線を引くコードです。
//@version=5
indicator( "target timestamp", overlay=true )

base_hour     = input.int( 17, "Hour", minval=0, maxval=23 )
base_minute   = input.int( 0, "Minute", minval=0, maxval=59 )
base_timezone = input.string( "America/New_York", "Timezone", options=["America/New_York","Asia/Tokyo","Etc/UTC","America/Los_Angeles","America/Chicago","America/Phoenix","America/Toronto","America/Vancouver","America/Argentina/Buenos_Aires","America/El_Salvador","America/Sao_Paulo","America/Bogota","Europe/Moscow","Europe/Athens","Europe/Berlin","Europe/London","Europe/Madrid","Europe/Paris","Europe/Warsaw","Australia/Sydney","Australia/Brisbane","Australia/ACT","Asia/Almaty","Asia/Ashkhabad","Asia/Taipei","Asia/Singapore","Asia/Shanghai","Asia/Seoul","Asia/Dubai","Asia/Hong_Kong","Asia/Bangkok","Pacific/Auckland","Pacific/Honolulu"] )

get_int_tz( str_timezone ) => str_timezone=="America/New_York" ? -4
     : str_timezone=="Asia/Tokyo" ? 9
     : str_timezone=="Etc/UTC" ? 0
     : str_timezone=="America/Los_Angeles" ? -7
     : str_timezone=="America/Chicago" ? -5
     : str_timezone=="America/Phoenix" ? -7
     : str_timezone=="America/Toronto" ? -4
     : str_timezone=="America/Vancouver" ? -7
     : str_timezone=="America/Argentina/Buenos_Aires" ? -3
     : str_timezone=="America/El_Salvador" ? -6
     : str_timezone=="America/Sao_Paulo" ? -3
     : str_timezone=="America/Bogota" ? -5
     : str_timezone=="Europe/Moscow" ? 3
     : str_timezone=="Europe/Athens" ? 3
     : str_timezone=="Europe/Berlin" ? 2
     : str_timezone=="Europe/London" ? 1
     : str_timezone=="Europe/Madrid" ? 2
     : str_timezone=="Europe/Paris" ? 2
     : str_timezone=="Europe/Warsaw" ? 2
     : str_timezone=="Australia/Sydney" ? 10
     : str_timezone=="Australia/Brisbane" ? 10
     : str_timezone=="Australia/ACT" ? 10
     : str_timezone=="Asia/Almaty" ? 6
     : str_timezone=="Asia/Ashkhabad" ? 5
     : str_timezone=="Asia/Taipei" ? 8
     : str_timezone=="Asia/Singapore" ? 8
     : str_timezone=="Asia/Shanghai" ? 8
     : str_timezone=="Asia/Seoul" ? 9
     : str_timezone=="Asia/Dubai" ? 4
     : str_timezone=="Asia/Hong_Kong" ? 8
     : str_timezone=="Asia/Bangkok" ? 7
     : str_timezone=="Pacific/Auckland" ?  12
     : str_timezone=="Pacific/Honolulu" ? -10 : 0

int_adjust_tz = get_int_tz( syminfo.timezone )
int_base_tz = get_int_tz( base_timezone )

checkGMT( h ,m ) =>
    gap = hour - int_adjust_tz + int_base_tz
    gap_day1 = gap >= 24 ? 1 : gap < 0 ? -1 : 0
    gap_day2 = h * 60 + m >= 24 * 60 ? 1 : 0
    gap_day1 + gap_day2

var int target_timestamp = na
hour_tz = hour( time, base_timezone )
if hour_tz == 0 or ( hour != hour[1] and hour_tz <= base_hour )
    target_timestamp := timestamp( base_timezone, year, month, dayofmonth + checkGMT( base_hour, base_minute ), base_hour, base_minute )

if time[1] < target_timestamp and target_timestamp <= time and timeframe.isintraday
    line.new( bar_index, high, bar_index, low, xloc.bar_index, extend.both )
夏時間の判定
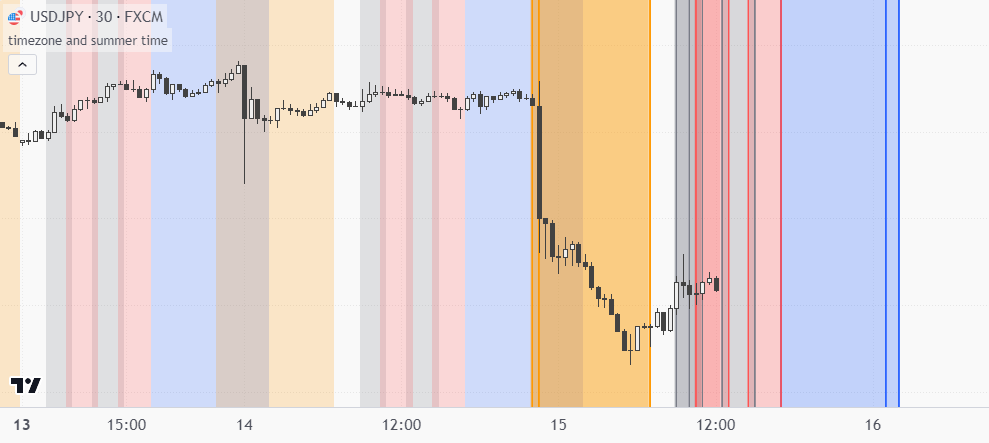
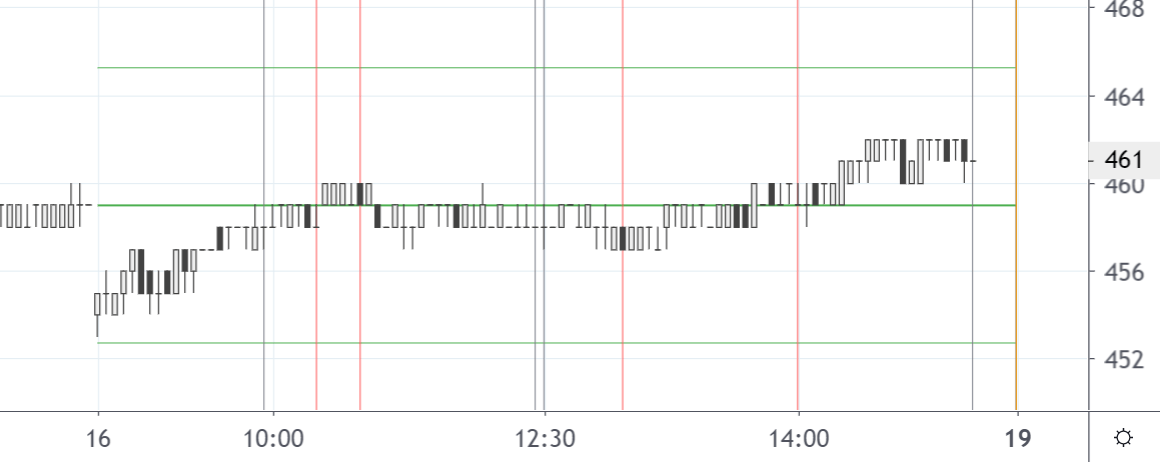
各国のOpen/Closeや、中値・経済指標等の発表時刻を描画するコードです。夏時間や各取引所の時差を認識し調整します。上図では、それぞれ「灰色:日本」「赤:香港」「青:ロンドン」「オレンジ:米国」を表しています。
//@version=5
indicator( 'timezone and summer time', overlay=true )

////
// 夏時間の判別
//
var s_ny_st = time
var s_uk_st = time
var e_ny_st = time
var e_uk_st = time
if( month[1] == 2 and month == 3 )
    remainder_s = ( 31 - dayofmonth ) % 7
    calc_pointday_s = 31 - remainder_s
    target_date_s_uk = 8 - dayofweek <= remainder_s ? calc_pointday_s + ( 8 - dayofweek ) : calc_pointday_s - ( dayofweek - 1 )
    s_uk_st := timestamp( "GMT", year, 3, target_date_s_uk, 1, 0 )
    target_date_s_ny = dayofweek <= dayofmonth ? dayofmonth - ( dayofweek -1 ) : dayofmonth + ( 8 - dayofweek )
    s_ny_st := timestamp( "GMT-4", year, 3, target_date_s_ny + 7, 2, 0 )
if( month[1] == 9 and month == 10 )
    remiander_e = ( 31 - dayofmonth ) % 7
    calc_pointday_e = 31 - remiander_e
    target_date_e_uk = 8 - dayofweek <= remiander_e ? calc_pointday_e + ( 8 - dayofweek ) : calc_pointday_e - ( dayofweek - 1 )
    e_uk_st := timestamp( "GMT", year, 10, target_date_e_uk, 1, 0 )
if( month[1] == 10 and month == 11 )
    target_date_e_ny = dayofweek <= dayofmonth ? dayofmonth - ( dayofweek -1 ) : dayofmonth + ( 8 - dayofweek )
    e_ny_st := timestamp( "GMT-4", year, 11, target_date_e_ny, 2, 0 )
toggle_ny_st = ( 3 < month and month < 11 ) or ( month==3 and s_ny_st <= time ) or ( month==11 and time <= e_ny_st )
toggle_uk_st = ( 3 < month and month < 10 ) or ( month==3 and s_uk_st <= time ) or ( month==10 and time <= e_uk_st )

get_int_tz( str_timezone ) => str_timezone=="America/New_York" ? -4
     : str_timezone=="Asia/Tokyo" ? 9
     : str_timezone=="Etc/UTC" ? 0
     : str_timezone=="America/Los_Angeles" ? -7
     : str_timezone=="America/Chicago" ? -5
     : str_timezone=="America/Phoenix" ? -7
     : str_timezone=="America/Toronto" ? -4
     : str_timezone=="America/Vancouver" ? -7
     : str_timezone=="America/Argentina/Buenos_Aires" ? -3
     : str_timezone=="America/El_Salvador" ? -6
     : str_timezone=="America/Sao_Paulo" ? -3
     : str_timezone=="America/Bogota" ? -5
     : str_timezone=="Europe/Moscow" ? 3
     : str_timezone=="Europe/Athens" ? 3
     : str_timezone=="Europe/Berlin" ? 2
     : str_timezone=="Europe/London" ? 1
     : str_timezone=="Europe/Madrid" ? 2
     : str_timezone=="Europe/Paris" ? 2
     : str_timezone=="Europe/Warsaw" ? 2
     : str_timezone=="Australia/Sydney" ? 10
     : str_timezone=="Australia/Brisbane" ? 10
     : str_timezone=="Australia/ACT" ? 10
     : str_timezone=="Asia/Almaty" ? 6
     : str_timezone=="Asia/Ashkhabad" ? 5
     : str_timezone=="Asia/Taipei" ? 8
     : str_timezone=="Asia/Singapore" ? 8
     : str_timezone=="Asia/Shanghai" ? 8
     : str_timezone=="Asia/Seoul" ? 9
     : str_timezone=="Asia/Dubai" ? 4
     : str_timezone=="Asia/Hong_Kong" ? 8
     : str_timezone=="Asia/Bangkok" ? 7
     : str_timezone=="Pacific/Auckland" ?  12
     : str_timezone=="Pacific/Honolulu" ? -10 : 0

int_adjust_tz = get_int_tz( syminfo.timezone )

checkGMT( gtm, h, m ) =>
    gap = hour - int_adjust_tz + gtm
    gap_day1 = gap >= 24 ? 1 : gap < 0 ? -1 : 0
    gap_day2 = h * 60 + m >= 24 * 60 ? 1 : 0
    gap_day1 + gap_day2

var jp1_open  = time
var jp_fix    = time
var jp1_close = time
var jp2_open  = time
var jp2_close = time
var hk1_open  = time
var hk1_close = time
var hk2_open  = time
var hk2_close = time
var uk_open   = time
var uk_fix    = time
var uk_close  = time
var us_econ   = time
var ny_open   = time
var ny_close  = time

arr_lines = array.new_line( 15, na )
arr_linefills = array.new_linefill( 6, na )
set_line_and_linefill( bar_index1, bar_index2, i1, i2, i_linefill, plot_color ) =>
    line_id_1 = line.new( bar_index1, high, bar_index1, low, xloc.bar_time, extend.both, plot_color )
    line_id_2 = line.new( bar_index2, high, bar_index2, low, xloc.bar_time, extend.both, plot_color )
    linefill_id = linefill.new( line_id_1, line_id_2, color.new( plot_color, 90 ) )
    array.set( arr_lines, i1, line_id_1 )
    array.set( arr_lines, i2, line_id_2 )
    array.set( arr_linefills, i_linefill, linefill_id )

if timeframe.isintraday
    jp1_open  := timestamp( "GMT+9", year, month, dayofmonth + checkGMT( 9 ,08 ,00 ), 09, 00 )
    jp_fix    := timestamp( "GMT+9", year, month, dayofmonth + checkGMT( 9 ,09 ,55 ), 09, 55 )
    jp1_close := timestamp( "GMT+9", year, month, dayofmonth + checkGMT( 9 ,11 ,00 ), 11, 00 )
    jp2_open  := timestamp( "GMT+9", year, month, dayofmonth + checkGMT( 9 ,12 ,30 ), 12, 30 )
    jp2_close := timestamp( "GMT+9", year, month, dayofmonth + checkGMT( 9 ,17 ,00 ), 15, 00 )
    hk1_open  := timestamp( "GMT+8", year, month, dayofmonth + checkGMT( 8 ,09 ,30 ), 09, 30 )
    hk1_close := timestamp( "GMT+8", year, month, dayofmonth + checkGMT( 8 ,12 ,00 ), 12, 00 )
    hk2_open  := timestamp( "GMT+8", year, month, dayofmonth + checkGMT( 8 ,13 ,30 ), 13, 30 )
    hk2_close := timestamp( "GMT+8", year, month, dayofmonth + checkGMT( 8 ,16 ,00 ), 16, 00 )
    uk_open   := toggle_uk_st ? timestamp( "GMT+1", year, month, dayofmonth + checkGMT( 1 ,08 ,00 ),  08, 00 ) : timestamp( "GMT",   year, month, dayofmonth + checkGMT( 0  ,08 ,00 ), 08, 00 )
    uk_fix    := toggle_uk_st ? timestamp( "GMT+1", year, month, dayofmonth + checkGMT( 1 ,16 ,00 ),  16, 00 ) : timestamp( "GMT",   year, month, dayofmonth + checkGMT( 0  ,16 ,00 ), 16, 00 )
    uk_close  := toggle_uk_st ? timestamp( "GMT+1", year, month, dayofmonth + checkGMT( 1 ,17 ,00 ),  17, 00 ) : timestamp( "GMT",   year, month, dayofmonth + checkGMT( 0  ,17 ,00 ), 17, 00 )
    ny_open   := toggle_ny_st ? timestamp( "GMT-4", year, month, dayofmonth + checkGMT( -4 ,08 ,00 ), 08, 00 ) : timestamp( "GMT-5", year, month, dayofmonth + checkGMT( -5 ,08 ,00 ), 08, 00 )
    us_econ   := toggle_ny_st ? timestamp( "GMT-4", year, month, dayofmonth + checkGMT( -4 ,08 ,30 ), 08, 30 ) : timestamp( "GMT-5", year, month, dayofmonth + checkGMT( -5 ,08 ,30 ), 08, 30 )
    ny_close  := toggle_ny_st ? timestamp( "GMT-4", year, month, dayofmonth + checkGMT( -4 ,17 ,00 ), 17, 00 ) : timestamp( "GMT-5", year, month, dayofmonth + checkGMT( -5 ,17 ,00 ), 17, 00 )
    for line_target in arr_lines
        line.delete( line_target )
    for linefill_target in arr_linefills
        linefill.delete( linefill_target )
    set_line_and_linefill( jp1_open, jp1_close, 0, 1, 0, color.gray )
    set_line_and_linefill( jp2_open, jp2_close, 2, 3, 1, color.gray )
    set_line_and_linefill( hk1_open, hk1_close, 4, 5, 2, color.red )
    set_line_and_linefill( hk2_open, hk2_close, 6, 7, 3, color.red )
    set_line_and_linefill( uk_open,  uk_close,  8, 9, 4, color.blue )
    set_line_and_linefill( ny_open,  ny_close, 10,11, 5, color.orange )
    array.set( arr_lines, 12, line.new( jp_fix  ,high ,jp_fix  ,low ,xloc.bar_time ,extend.both ,color.gray ) )
    array.set( arr_lines, 13, line.new( uk_fix  ,high ,uk_fix  ,low ,xloc.bar_time ,extend.both ,color.blue ) )
    array.set( arr_lines, 14, line.new( us_econ ,high ,us_econ ,low ,xloc.bar_time ,extend.both ,color.orange ) )

var is_weekend = false
is_saturday = dayofweek == dayofweek.saturday
is_end_of_sunday = ( dayofweek == dayofweek.sunday and dayofmonth[1] != dayofmonth ) or ( dayofweek[1] == dayofweek.sunday and dayofweek == dayofweek.monday )
if is_saturday
    is_weekend := true
if is_end_of_sunday
    is_weekend := false
JP = not is_weekend and timeframe.isintraday and ( ( jp1_open <= time and time < jp1_close ) or ( jp2_open <= time and time < jp2_close ) ) ? color.new( color.gray, 80 ) : color.new( color.white, 100 )
HK = not is_weekend and timeframe.isintraday and ( ( hk1_open <= time and time < hk1_close ) or ( hk2_open <= time and time < hk2_close ) ) ? color.new( color.red,  80 ) : color.new( color.white, 100 )
UK = not is_weekend and timeframe.isintraday and uk_open <= time and time < uk_close ? color.new( color.blue,   80 ) : color.new( color.white, 100 )
NY = not is_weekend and timeframe.isintraday and ny_open <= time and time < ny_close ? color.new( color.orange, 80 ) : color.new( color.white, 100 )
bgcolor( JP ,title="日本" )
bgcolor( HK ,title="香港" )
bgcolor( UK ,title="ロンドン" )
bgcolor( NY ,title="ニューヨーク" )
bar_indexに加算して、将来のbar_indexを取得
bar_indexで現在の足のインデックスを取得するのですが、最新の足よりも将来の足でも加算で指定することができます。
//@version=5
indicator( 'add to bar_index', overlay=true )
target_datetime = input.time( 0, '基準とする日時', confirm=true, tooltip='基準とするローソク足を選びます' )

var int target_index = na
if time >= target_datetime and time[1] < target_datetime
    target_index := bar_index

set_line( span ) =>
    target = target_index + span
    line.new( target, close, target, close * .95, xloc.bar_index, extend.both )

if not na( target_index ) and barstate.islast
    set_line( 10 )
    set_line( 20 )
    set_line( 30 )
    set_line( 40 )
昔はこれができず、timestampで頑張って算出するしかありませんでした。週をまたいだり祝日があったり、取引所によってOpen/Closeの時間が異なったりと、N本先を正確に取得するのが結構大変でした。
bar_indexによる過去位置の指定には制限がある
PineスクリプトのSeriseは、リアルタイムに入ると5000データ以上さかのぼれません。バッファ(ヒストリカルデータ)の制限が入ります。
I see 'Pine cannot determine the referencing length of a series. Try using max_bars_back' error — TradingView
Find answers to any questions about how to use TradingView — charts, trades, billing, data, desktop & mobile apps and much more. Learn how to use the platform and get the most out of your experience.
www.tradingview.com

bar_indexの減算はtimeに変換して処理されている(らしい)ので、bar_index - 6000等の処理を行うとヒストリカルデータの制限に引っかかってしまいます。
メインチャート以外のデータを取得
TradingViewは、価格データに限らず、あらゆるデータを参照することができます。Pineスクリプトの強力なメリットのひとつです。
security()で別の銘柄や時間軸のデータを取得
security()で、チャート以外の銘柄のデータを取得できる。security("usdjpy" ,"D" ,close)のcloseを、ema(close ,20)などと指定することもできる。以下のコードは、メインチャートの価格を指定した通貨で為替換算するもの。
currency = input("None" ,title="為替換算" ,options=["None" ,"USD" ,"EUR" ,"GBP" ,"AUD" ,"CAD" ,"CHF"])

get_root(currency) =>
     currency=="USD" ? "usdjpy" :
     currency=="EUR" ? "eurjpy" :
     currency=="GBP" ? "gbpjpy" :
     currency=="AUD" ? "audjpy" :
     currency=="CAD" ? "cadjpy" :
     currency=="CHF" ? "chfjpy" :
     "usdjpy"

sc1(currency ,root) =>
     currency=="None" ? 1 :
     security(root ,"D" ,close)

root = get_root(currency)
value = close * sc1(currency ,root)
※ 銘柄コード「4005」など、複数の取引所で同じコードが使われている場合、「TSE:4005」のように取引所コードで渡さないと取得することができない。組込み変数なら、tickerではなくtickeridを使うこと。
メインチャートより上の時間軸の価格を取得することもできる。
//1時間足を取得
Security( syminfo.tickerid ,"60" ,close )

//4時間足を取得
Security( syminfo.tickerid ,"240" ,close )

//日足を取得
Security( syminfo.tickerid ,"D" ,close )

//週足を取得
Security( syminfo.tickerid ,"W" ,close )

//月足を取得
Security( syminfo.tickerid ,"M" ,close )
日足の正確な四本値
OSE:NK225の金~月曜日にかけてなど、Security()で取得する価格データがズレることがある。正確な日足などの四本値が欲しい場合は、以下のように対応する。
//@version=4

sessionStart = input( "Morning" ,options=[ "Night" ,"Morning" ]  )

is_nkx = syminfo.root=="NK225" or syminfo.root=="NK225M"

morning_open = hour[1] == 05 and hour == 08 and minute >= 30
night_open = hour[1] == 15 and hour == 16 and minute >= 30

is_morning_open = sessionStart=="Morning" and morning_open
is_night_open = sessionStart=="Night" and night_open

is_open = is_nkx and ( is_morning_open or is_night_open )

var float dayOpen = na

dayOpen := is_open ? open : dayOpen[1]
財務指標や経済データを取得
四本値以外のデータを元にしたストラテジーをつくることができます。せっせと色んなところからデータを集めてくる必要がなくなります。
//@version=5
indicator("request.financial")
f = request.financial("NASDAQ:MSFT", "ACCOUNTS_PAYABLE", "FY")
plot(f)//@version=5
indicator("US GDP")
e = request.economic("US", "GDP")
plot(e)Nasdaq Data Link(旧Quandl)から外部の金融データを取得
Nasdaq Data Link (旧Quandl) のデータを取得することもできます。人口やGDPの推移、機関投資家の取引状況等を確認することができます。quande()という専用の関数も用意されています。
以下のコードは、CFTCの建玉明細を表示するもの。
//@vertion=3
force_root = input("", title="Override Product")
is_includeoptions = input(false, type=bool, title="Include Options")

fxroot =
    ticker == "USDCAD" ? "CD" :
    ticker == "USDCAD" ? "CD" :
    ticker == "USDCHF" ? "SF" :
    ticker == "USDCZK" ? "CZ" :
    ticker == "USDHUF" ? "FR" :
    ticker == "USDILS" ? "IS" :
    ticker == "USDJPY" ? "JY" :
    ticker == "USDMXN" ? "MP" :
    ticker == "USDNOK" ? "UN" :
    ticker == "USDPLN" ? "PZ" :
    ticker == "USDRUB" ? "RU" :
    ticker == "USDSEK" ? "SE" :
    ticker == "USDZAR" ? "RA" :
    ticker == "EURUSD" ? "EC" :
    ticker == "AUDUSD" ? "AD" :
    ticker == "GBPUSD" ? "BP" :
    ticker == "NZDUSD" ? "NE" :
    ticker == "BRLUSD" ? "BR" :
    ""

root = force_root == "" ? fxroot == "" ? syminfo.root : fxroot : force_root
code = root + (is_includeoptions ? "_FO" : "_F") + "_L_ALL"

long = security("QUANDL:CFTC/"+code+"|1", "D", close)
short = security("QUANDL:CFTC/"+code+"|2", "D", close)

plot(long, color = red, title="Long" ,style=stepline)
plot(short, color = blue, title="Short" ,style=stepline)
plot(long-short, color = orange, title="Net", style=columns ,transp=50)
Nasdaq Data Link
The source for financial, economic, and alternative datasets, serving investment professionals.
data.nasdaq.com

新値足や平均足、カギ足等のデータを取得
新値足のインジケーターをつくったことがありますが、そのときにこれがあれば、もっと簡単につくれていたと思います。
//@version=5
indicator("ticker.linebreak", overlay=true)
linebreak_tickerid = ticker.linebreak(syminfo.tickerid, 3)
linebreak_close = request.security(linebreak_tickerid, timeframe.period, close)
plot(linebreak_close)security_lower_tf()で下位足のデータを取得
例えば、日足のUSDJPYで上記のコードを動かすと、各足ごとに1時間足24本分の配列を取得できます。このとき、i=0が最も古いデータになります。
表示しているチャートよりも大きな足種のデータを取りにいくと、エラーが返るので注意が必要です。
//@version=5
indicator("`request.security_lower_tf()` Example", overlay = true)

// If the current chart timeframe is set to 120 minutes, then the `arrayClose` array will contain two 'close' values from the 60 minute timeframe for each bar.
arrClose = request.security_lower_tf(syminfo.tickerid, "60", close)

if bar_index == last_bar_index - 1
label.new(bar_index, high, str.tostring(arrClose))seed()でgithub上のデータにアクセスできるように!
外部データを自由に取得ができないことがPineスクリプトの大きな弱点の一つだったのですが、いつの間にか克服されていました!
//@version=5
indicator("BTC Development Activity")

[devAct, devActSMA] = request.seed("seed_crypto_santiment", "BTC_DEV_ACTIVITY", [close, ta.sma(close, 10)])

plot(devAct, "BTC Development Activity")
plot(devActSMA, "BTC Development Activity SMA10", color = color.yellow)例えば、Pythonで機械学習させて、その結果をTradingViewに取り込むような使い方ができるんじゃないかなと思います。めちゃくちゃ幅が広がります(やりませんが)。
直線を引く
naで間を空けて
naが入ると、有効なデータの点と点を直線でつないでくれる。
//@version=3

isRegularFractal(mode) =>
    ret = mode == 1 ? high[4] < high[3] and high[3] < high[2] and high[2] > high[1] and high[1] > high[0] : mode == -1 ? low[4] > low[3] and low[3] > low[2] and low[2] < low[1] and low[1] < low[0] : false

topFractal = isRegularFractal(1) ? high[2] : isRegularFractal(-1) ? low[2] : na

plot(topFractal ,color=red ,offset=-2)
上昇幅を算出して
タイムラインと上昇幅を算出して、力技で直線を引く。
//@version=3

shortl   = input(10)
longl    = input(100)
offset_f = input(2)
offset_b = input(20)

// タイムラインを作成しておく
timeline = 0
timeline:= nz(timeline[1]) + 1

// ボトムを探す
a = valuewhen(low==lowest(low ,shortl) ,low ,0)
b = valuewhen(low==lowest(low ,longl)  ,low ,0)
whena = valuewhen(low==lowest(low ,shortl) ,timeline ,0)
whenb = valuewhen(low==lowest(low ,longl)  ,timeline ,0)

m                 = (b-a) / (whenb-whena)
bot_price         = m * (timeline-whena) + a
back_bot_price    = m * (timeline-whena-offset_b) + a
forward_bot_price = m * (timeline-whena+offset_f) + a
bot_price        := b-a==0 ? nz(bot_price[1]) : bot_price
same_bot          = a==a[1] and b==b[1] and a!=0 and b!=0 and whena!=whenb

plot(same_top ? top_price         : na ,style=linebr ,color=red ,linewidth=2 ,offset= 0        ,transp=50 ,title="_top")
plot(same_top ? back_top_price    : na ,style=linebr ,color=red ,linewidth=1 ,offset=-offset_b ,transp=50 ,title="back_top")
plot(same_top ? forward_top_price : na ,style=linebr ,color=red ,linewidth=1 ,offset= offset_f ,transp=70 ,title="forward_top")line.new()を使って
使いやすい。
//@version=4

showHL = input( true  ,title="当日クローズまでの ヨコ線 を描画 (30分足以下)")
showVL = input( true  ,title="当日クローズまでの タテ線 の描画 (30分足以下)" )

is_intraday_smaller30 = timeframe.isintraday and timeframe.multiplier <= 30

b4high5 = security( syminfo.tickerid ,"D" ,highest( high ,5 )[1] ,lookahead=barmerge.lookahead_on )
b4low5  = security( syminfo.tickerid ,"D" ,lowest( low ,5 )[1]   ,lookahead=barmerge.lookahead_on )
b4mid5  = ( b4high5 + b4low5 ) / 2

is_nan = b4atr[1]!=b4atr

var start     = time
var end       = time

if is_nan and is_intraday_smaller30
    start := timestamp( year,month,dayofmonth,hour,minute )
    end   := timestamp( year,month, dayofmonth + 1 ,hour,minute )

var line ln_high5 = na
var line ln_mid5 = na
var line ln_low5 = na

var line ln_01 = na
var line ln_02 = na

if showHL
    line.delete( ln_high5 )
    line.delete( ln_mid5 )
    line.delete( ln_low5 )
    ln_high5 := line.new( start ,b4high5 ,end ,b4high5 ,xloc.bar_time )
    ln_mid5  := line.new( start ,b4mid5  ,end ,b4mid5  ,xloc.bar_time )
    ln_low5  := line.new( start ,b4low5  ,end ,b4low5  ,xloc.bar_time )

if showVL
    line.delete( ln_01 )
    line.delete( ln_02 )
    ln_01 := line.new( start ,b4high5 ,end ,b4low5 ,xloc.bar_time )
ln_02 := line.new( start ,b4high5 ,end ,b4low5 ,xloc.bar_time )poly.new()を使って
引用元: Volume Profile with a few polylines - fikira
1つのオブジェクトで複雑な描画ができます。
こういうグラフは、今まではboxやlineをたくさん並べるしかなく500個までという制限がありましたが、1つのオブジェクトで解決できるようになりました。曲線の描画もでき、表現の幅が広がります。
詳細なマーケットプロファイルのインジケーターとか、作れると思います。
Pineスクリプト™ マニュアル - plyline.new()
jp.tradingview.com
塗りつぶす
Pineスクリプトはこの塗りつぶしが使いやすく、MQLよりもキレイなインジケーターがつくりやすいです。
fill()
plot同士やhline同士の間を塗りつぶすことができます。plot同士ならグラデーションにすることもできます。
//@version=5
indicator("Fill between plots", overlay = true)
p1 = plot(open)
p2 = plot(close)
fill(p1, p2, color = color.new(color.green, 90))linefill.new()
line.new()で描画した2つのラインの間を塗りつぶすことができます。夏時間の判定のコードで使っています。
Pineスクリプト™ マニュアル - linefill
jp.tradingview.com
box.new()
2点を指定して、boxを描画することができます。
//@version=5
indicator("box.new")
var b = box.new(time, open, time + 60 * 60 * 24, close, xloc=xloc.bar_time, border_style=line.style_dashed)
box.set_lefttop(b, time, 100)
box.set_rightbottom(b, time + 60 * 60 * 24, 500)
box.set_bgcolor(b, color.green)情報を格納する
配列(array)
配列は情報の格納に非常によく使います。この記事の中でも、夏時間の判定のコードで情報の��格納に使っています。同じ処理でも短いコードで記述できるようになり、管理も容易になります。
以下のコードでは、取得している全データの、実体と窓の「平均」「標準偏差」(いずれも対数の差分)を算出しています。
//@version=5

stdev_multiplier = 2

body = math.log(close) - math.log(open)
body_abs = math.abs(body)
var array_body = array.new_float(0)
array.push(array_body, body_abs)
body_mean = array.avg(array_body)
body_stdev = array.stdev(array_body)

gap = math.log(open) - math.log(close[1])
gap_abs = math.abs(gap)
var array_gap = array.new_float(0)
if gap > 0
    array.push(array_gap, gap_abs)
gap_mean = array.avg(array_gap)
gap_stdev = array.stdev(array_gap)

plot( body_abs, "body", color=color.red )
plot( body_mean + body_stdev * stdev_multiplier ,"body mean + stdev", color=color.red )
plot( gap_abs, "gap" )
plot( gap_mean + gap_stdev * stdev_multiplier ,"gap mena + stdev" )
相関係数一覧表
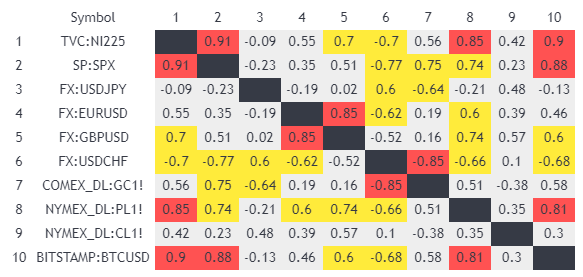
以下は、配列を活用して相関係数一覧表を作成しています。
//@version=5
indicator( '相関係数一覧表', precision=2, overlay=true )

s1 = input.symbol( '', inline='s1' )
s2 = input.symbol( '', inline='s2' )
s3 = input.symbol( '', inline='s3' )
s4 = input.symbol( '', inline='s4' )
s5 = input.symbol( '', inline='s5' )
s6 = input.symbol( '', inline='s6' )
s7 = input.symbol( '', inline='s7' )
s8 = input.symbol( '', inline='s8' )
s9 = input.symbol( '', inline='s9' )
s10 = input.symbol( '', inline='s10' )
timeframe = input.timeframe( 'D', '時間軸', inline="算出の条件", group="算出の条件"  )
len = input( 1000, inline="算出の条件", group="算出の条件" )
threshold_high = input( .8, "強", inline="強い相関", group="相関表の設定" )
color_high_p = input.color( color.red, "順", inline="強い相関", group="相関表の設定" )
color_high_m = input.color( color.red, "逆", inline="強い相関", group="相関表の設定" )
threshold_mid = input( .6, "中", inline="中程度の相関", group="相関表の設定" )
color_mid_p = input( color.yellow, "順", inline="中程度の相関", group="相関表の設定" )
color_mid_m = input( color.yellow, "逆", inline="中程度の相関", group="相関表の設定" )
color_low = input( color.new( #eeeeee, 0 ), "弱", inline="弱い相関", group="相関表の設定" )
color_same = input( color.black, "同じ銘柄", inline="弱い相関", group="相関表の設定" )
color_base = input( color.white, "背景", inline="色", group="相関表の設定" )
color_text = input( color.black, "テキスト", inline="色", group="相関表の設定" )

num = 10
get_color( x ) => x > .999 ? color_same
     : x >= threshold_high ? color_high_p
     : x >= threshold_mid ? color_mid_p
     : x <= -threshold_high ? color_high_m
     : x <= -threshold_mid ? color_mid_m
     : color_low

close_s1 = s1=='' ? na : request.security( s1, timeframe, close )
close_s2 = s2=='' ? na : request.security( s2, timeframe, close )
close_s3 = s3=='' ? na : request.security( s3, timeframe, close )
close_s4 = s4=='' ? na : request.security( s4, timeframe, close )
close_s5 = s5=='' ? na : request.security( s5, timeframe, close )
close_s6 = s6=='' ? na : request.security( s6, timeframe, close )
close_s7 = s7=='' ? na : request.security( s7, timeframe, close )
close_s8 = s8=='' ? na : request.security( s8, timeframe, close )
close_s9 = s9=='' ? na : request.security( s9, timeframe, close )
close_s10 = s10=='' ? na : request.security( s10, timeframe, close )

var arr_correl_s1 = array.new_float( num, na )
var arr_correl_s2 = array.new_float( num, na )
var arr_correl_s3 = array.new_float( num, na )
var arr_correl_s4 = array.new_float( num, na )
var arr_correl_s5 = array.new_float( num, na )
var arr_correl_s6 = array.new_float( num, na )
var arr_correl_s7 = array.new_float( num, na )
var arr_correl_s8 = array.new_float( num, na )
var arr_correl_s9 = array.new_float( num, na )
var arr_correl_s10 = array.new_float( num, na )

array.set( arr_correl_s1, 0, math.round( ta.correlation( close_s1, close_s1, len ), 2 ) )
array.set( arr_correl_s1, 1, math.round( ta.correlation( close_s1, close_s2, len ), 2 ) )
array.set( arr_correl_s1, 2, math.round( ta.correlation( close_s1, close_s3, len ), 2 ) )
array.set( arr_correl_s1, 3, math.round( ta.correlation( close_s1, close_s4, len ), 2 ) )
array.set( arr_correl_s1, 4, math.round( ta.correlation( close_s1, close_s5, len ), 2 ) )
array.set( arr_correl_s1, 5, math.round( ta.correlation( close_s1, close_s6, len ), 2 ) )
array.set( arr_correl_s1, 6, math.round( ta.correlation( close_s1, close_s7, len ), 2 ) )
array.set( arr_correl_s1, 7, math.round( ta.correlation( close_s1, close_s8, len ), 2 ) )
array.set( arr_correl_s1, 8, math.round( ta.correlation( close_s1, close_s9, len ), 2 ) )
array.set( arr_correl_s1, 9, math.round( ta.correlation( close_s1, close_s10, len ), 2 ) )

array.set( arr_correl_s2, 0, math.round( ta.correlation( close_s2, close_s1, len ), 2 ) )
array.set( arr_correl_s2, 1, math.round( ta.correlation( close_s2, close_s2, len ), 2 ) )
array.set( arr_correl_s2, 2, math.round( ta.correlation( close_s2, close_s3, len ), 2 ) )
array.set( arr_correl_s2, 3, math.round( ta.correlation( close_s2, close_s4, len ), 2 ) )
array.set( arr_correl_s2, 4, math.round( ta.correlation( close_s2, close_s5, len ), 2 ) )
array.set( arr_correl_s2, 5, math.round( ta.correlation( close_s2, close_s6, len ), 2 ) )
array.set( arr_correl_s2, 6, math.round( ta.correlation( close_s2, close_s7, len ), 2 ) )
array.set( arr_correl_s2, 7, math.round( ta.correlation( close_s2, close_s8, len ), 2 ) )
array.set( arr_correl_s2, 8, math.round( ta.correlation( close_s2, close_s9, len ), 2 ) )
array.set( arr_correl_s2, 9, math.round( ta.correlation( close_s2, close_s10, len ), 2 ) )

array.set( arr_correl_s3, 0, math.round( ta.correlation( close_s3, close_s1, len ), 2 ) )
array.set( arr_correl_s3, 1, math.round( ta.correlation( close_s3, close_s2, len ), 2 ) )
array.set( arr_correl_s3, 2, math.round( ta.correlation( close_s3, close_s3, len ), 2 ) )
array.set( arr_correl_s3, 3, math.round( ta.correlation( close_s3, close_s4, len ), 2 ) )
array.set( arr_correl_s3, 4, math.round( ta.correlation( close_s3, close_s5, len ), 2 ) )
array.set( arr_correl_s3, 5, math.round( ta.correlation( close_s3, close_s6, len ), 2 ) )
array.set( arr_correl_s3, 6, math.round( ta.correlation( close_s3, close_s7, len ), 2 ) )
array.set( arr_correl_s3, 7, math.round( ta.correlation( close_s3, close_s8, len ), 2 ) )
array.set( arr_correl_s3, 8, math.round( ta.correlation( close_s3, close_s9, len ), 2 ) )
array.set( arr_correl_s3, 9, math.round( ta.correlation( close_s3, close_s10, len ), 2 ) )

array.set( arr_correl_s4, 0, math.round( ta.correlation( close_s4, close_s1, len ), 2 ) )
array.set( arr_correl_s4, 1, math.round( ta.correlation( close_s4, close_s2, len ), 2 ) )
array.set( arr_correl_s4, 2, math.round( ta.correlation( close_s4, close_s3, len ), 2 ) )
array.set( arr_correl_s4, 3, math.round( ta.correlation( close_s4, close_s4, len ), 2 ) )
array.set( arr_correl_s4, 4, math.round( ta.correlation( close_s4, close_s5, len ), 2 ) )
array.set( arr_correl_s4, 5, math.round( ta.correlation( close_s4, close_s6, len ), 2 ) )
array.set( arr_correl_s4, 6, math.round( ta.correlation( close_s4, close_s7, len ), 2 ) )
array.set( arr_correl_s4, 7, math.round( ta.correlation( close_s4, close_s8, len ), 2 ) )
array.set( arr_correl_s4, 8, math.round( ta.correlation( close_s4, close_s9, len ), 2 ) )
array.set( arr_correl_s4, 9, math.round( ta.correlation( close_s4, close_s10, len ), 2 ) )

array.set( arr_correl_s5, 0, math.round( ta.correlation( close_s5, close_s1, len ), 2 ) )
array.set( arr_correl_s5, 1, math.round( ta.correlation( close_s5, close_s2, len ), 2 ) )
array.set( arr_correl_s5, 2, math.round( ta.correlation( close_s5, close_s3, len ), 2 ) )
array.set( arr_correl_s5, 3, math.round( ta.correlation( close_s5, close_s4, len ), 2 ) )
array.set( arr_correl_s5, 4, math.round( ta.correlation( close_s5, close_s5, len ), 2 ) )
array.set( arr_correl_s5, 5, math.round( ta.correlation( close_s5, close_s6, len ), 2 ) )
array.set( arr_correl_s5, 6, math.round( ta.correlation( close_s5, close_s7, len ), 2 ) )
array.set( arr_correl_s5, 7, math.round( ta.correlation( close_s5, close_s8, len ), 2 ) )
array.set( arr_correl_s5, 8, math.round( ta.correlation( close_s5, close_s9, len ), 2 ) )
array.set( arr_correl_s5, 9, math.round( ta.correlation( close_s5, close_s10, len ), 2 ) )

array.set( arr_correl_s6, 0, math.round( ta.correlation( close_s6, close_s1, len ), 2 ) )
array.set( arr_correl_s6, 1, math.round( ta.correlation( close_s6, close_s2, len ), 2 ) )
array.set( arr_correl_s6, 2, math.round( ta.correlation( close_s6, close_s3, len ), 2 ) )
array.set( arr_correl_s6, 3, math.round( ta.correlation( close_s6, close_s4, len ), 2 ) )
array.set( arr_correl_s6, 4, math.round( ta.correlation( close_s6, close_s5, len ), 2 ) )
array.set( arr_correl_s6, 5, math.round( ta.correlation( close_s6, close_s6, len ), 2 ) )
array.set( arr_correl_s6, 6, math.round( ta.correlation( close_s6, close_s7, len ), 2 ) )
array.set( arr_correl_s6, 7, math.round( ta.correlation( close_s6, close_s8, len ), 2 ) )
array.set( arr_correl_s6, 8, math.round( ta.correlation( close_s6, close_s9, len ), 2 ) )
array.set( arr_correl_s6, 9, math.round( ta.correlation( close_s6, close_s10, len ), 2 ) )

array.set( arr_correl_s7, 0, math.round( ta.correlation( close_s7, close_s1, len ), 2 ) )
array.set( arr_correl_s7, 1, math.round( ta.correlation( close_s7, close_s2, len ), 2 ) )
array.set( arr_correl_s7, 2, math.round( ta.correlation( close_s7, close_s3, len ), 2 ) )
array.set( arr_correl_s7, 3, math.round( ta.correlation( close_s7, close_s4, len ), 2 ) )
array.set( arr_correl_s7, 4, math.round( ta.correlation( close_s7, close_s5, len ), 2 ) )
array.set( arr_correl_s7, 5, math.round( ta.correlation( close_s7, close_s6, len ), 2 ) )
array.set( arr_correl_s7, 6, math.round( ta.correlation( close_s7, close_s7, len ), 2 ) )
array.set( arr_correl_s7, 7, math.round( ta.correlation( close_s7, close_s8, len ), 2 ) )
array.set( arr_correl_s7, 8, math.round( ta.correlation( close_s7, close_s9, len ), 2 ) )
array.set( arr_correl_s7, 9, math.round( ta.correlation( close_s7, close_s10, len ), 2 ) )

array.set( arr_correl_s8, 0, math.round( ta.correlation( close_s8, close_s1, len ), 2 ) )
array.set( arr_correl_s8, 1, math.round( ta.correlation( close_s8, close_s2, len ), 2 ) )
array.set( arr_correl_s8, 2, math.round( ta.correlation( close_s8, close_s3, len ), 2 ) )
array.set( arr_correl_s8, 3, math.round( ta.correlation( close_s8, close_s4, len ), 2 ) )
array.set( arr_correl_s8, 4, math.round( ta.correlation( close_s8, close_s5, len ), 2 ) )
array.set( arr_correl_s8, 5, math.round( ta.correlation( close_s8, close_s6, len ), 2 ) )
array.set( arr_correl_s8, 6, math.round( ta.correlation( close_s8, close_s7, len ), 2 ) )
array.set( arr_correl_s8, 7, math.round( ta.correlation( close_s8, close_s8, len ), 2 ) )
array.set( arr_correl_s8, 8, math.round( ta.correlation( close_s8, close_s9, len ), 2 ) )
array.set( arr_correl_s8, 9, math.round( ta.correlation( close_s8, close_s10, len ), 2 ) )

array.set( arr_correl_s9, 0, math.round( ta.correlation( close_s9, close_s1, len ), 2 ) )
array.set( arr_correl_s9, 1, math.round( ta.correlation( close_s9, close_s2, len ), 2 ) )
array.set( arr_correl_s9, 2, math.round( ta.correlation( close_s9, close_s3, len ), 2 ) )
array.set( arr_correl_s9, 3, math.round( ta.correlation( close_s9, close_s4, len ), 2 ) )
array.set( arr_correl_s9, 4, math.round( ta.correlation( close_s9, close_s5, len ), 2 ) )
array.set( arr_correl_s9, 5, math.round( ta.correlation( close_s9, close_s6, len ), 2 ) )
array.set( arr_correl_s9, 6, math.round( ta.correlation( close_s9, close_s7, len ), 2 ) )
array.set( arr_correl_s9, 7, math.round( ta.correlation( close_s9, close_s8, len ), 2 ) )
array.set( arr_correl_s9, 8, math.round( ta.correlation( close_s9, close_s9, len ), 2 ) )
array.set( arr_correl_s9, 9, math.round( ta.correlation( close_s9, close_s10, len ), 2 ) )

array.set( arr_correl_s10, 0, math.round( ta.correlation( close_s10, close_s1, len ), 2 ) )
array.set( arr_correl_s10, 1, math.round( ta.correlation( close_s10, close_s2, len ), 2 ) )
array.set( arr_correl_s10, 2, math.round( ta.correlation( close_s10, close_s3, len ), 2 ) )
array.set( arr_correl_s10, 3, math.round( ta.correlation( close_s10, close_s4, len ), 2 ) )
array.set( arr_correl_s10, 4, math.round( ta.correlation( close_s10, close_s5, len ), 2 ) )
array.set( arr_correl_s10, 5, math.round( ta.correlation( close_s10, close_s6, len ), 2 ) )
array.set( arr_correl_s10, 6, math.round( ta.correlation( close_s10, close_s7, len ), 2 ) )
array.set( arr_correl_s10, 7, math.round( ta.correlation( close_s10, close_s8, len ), 2 ) )
array.set( arr_correl_s10, 8, math.round( ta.correlation( close_s10, close_s9, len ), 2 ) )
array.set( arr_correl_s10, 9, math.round( ta.correlation( close_s10, close_s10, len ), 2 ) )

if barstate.islast
    var table_correl = table.new( position.bottom_left, num+2, num+1 )
    table.cell( table_correl, 0, 0, "", bgcolor=color_base, text_color=color_text )
    table.cell( table_correl, 1, 0, "Symbol", bgcolor=color_base, text_color=color_text )

    for i=1 to num
        symbol_i = i==1 ? s1 : i==2 ? s2 : i==3 ? s3 : i==4 ? s4 : i==5 ? s5 : i==6 ? s6 : i==7 ? s7 : i==8 ? s8 : i==9 ? s9 : s10
        if symbol_i != ''
            table.cell( table_correl, i+1, 0, str.tostring( i ), bgcolor=color_base, text_color=color_text )

    for i=1 to num
        symbol_i = i==1 ? s1 : i==2 ? s2 : i==3 ? s3 : i==4 ? s4 : i==5 ? s5 : i==6 ? s6 : i==7 ? s7 : i==8 ? s8 : i==9 ? s9 : s10
        if symbol_i != ''
            correl_1_i = array.get( arr_correl_s1, i-1 )
            correl_2_i = array.get( arr_correl_s2, i-1 )
            correl_3_i = array.get( arr_correl_s3, i-1 )
            correl_4_i = array.get( arr_correl_s4, i-1 )
            correl_5_i = array.get( arr_correl_s5, i-1 )
            correl_6_i = array.get( arr_correl_s6, i-1 )
            correl_7_i = array.get( arr_correl_s7, i-1 )
            correl_8_i = array.get( arr_correl_s8, i-1 )
            correl_9_i = array.get( arr_correl_s9, i-1 )
            correl_10_i = array.get( arr_correl_s10, i-1 )
            table.cell( table_correl, 0, i, str.tostring( i ), bgcolor=color_base, text_color=color_text )
            table.cell( table_correl, 1, i, symbol_i, bgcolor=color_base, text_color=color_text )
            if s1 != ''
                table.cell( table_correl, 2, i, str.tostring( correl_1_i ), bgcolor=get_color( correl_1_i ), text_color=color_text )
            if s2 != ''
                table.cell( table_correl, 3, i, str.tostring( correl_2_i ), bgcolor=get_color( correl_2_i ), text_color=color_text )
            if s3 != ''
                table.cell( table_correl, 4, i, str.tostring( correl_3_i ), bgcolor=get_color( correl_3_i ), text_color=color_text )
            if s4 != ''
                table.cell( table_correl, 5, i, str.tostring( correl_4_i ), bgcolor=get_color( correl_4_i ), text_color=color_text )
            if s5 != ''
                table.cell( table_correl, 6, i, str.tostring( correl_5_i ), bgcolor=get_color( correl_5_i ), text_color=color_text )
            if s6 != ''
                table.cell( table_correl, 7, i, str.tostring( correl_6_i ), bgcolor=get_color( correl_6_i ), text_color=color_text )
            if s7 != ''
                table.cell( table_correl, 8, i, str.tostring( correl_7_i ), bgcolor=get_color( correl_7_i ), text_color=color_text )
            if s8 != ''
                table.cell( table_correl, 9, i, str.tostring( correl_8_i ), bgcolor=get_color( correl_8_i ), text_color=color_text )
            if s9 != ''
                table.cell( table_correl, 10, i, str.tostring( correl_9_i ), bgcolor=get_color( correl_9_i ), text_color=color_text )
            if s10 != ''
                table.cell( table_correl, 11, i, str.tostring( correl_10_i ), bgcolor=get_color( correl_10_i ), text_color=color_text )
matrix
配列は1次元のデータですが、これを2次元にしたものがmatrixです。
Excelでいうと、配列が「1行 × N列」のデータだったのに対して、matrixは「N行 × N列」のデータです。
私自身はあまり活用したことがないのですが、matrixはデータを格納してまとめて計算するのが得意です。
Pineスクリプト™ マニュアル - matrix.new<type>()
jp.tradingview.com
map
mapは情報を取り出しやすく格納するのが得意です。JavaScriptなら「連想配列」、Pythonなら「Dictionary」にあたります。
Pineスクリプト™ マニュアル - map.new<type,type>()
jp.tradingview.com
情報を表示する
plotshape()を使って
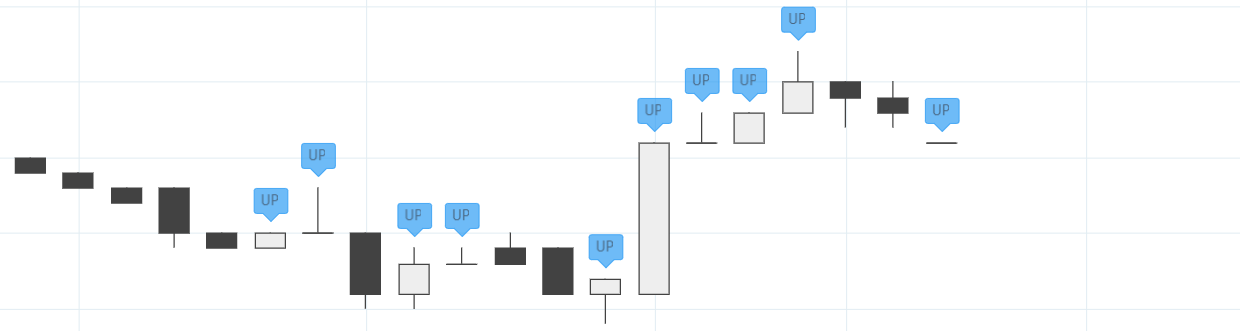
version3まではこれしかできなかった。textの内容をtostring()で動的に変えるようなことはできない。
//@version=4
data = close >= open
plotshape( data ,text="UP" ,textcolor=color.black ,style=shape.labeldown )label.new()を使って
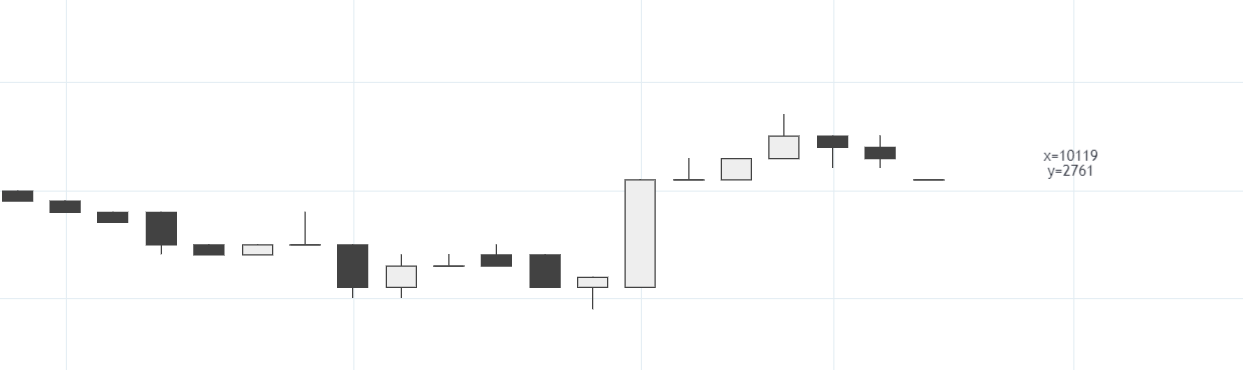
bar_indexで位置を指定したり、
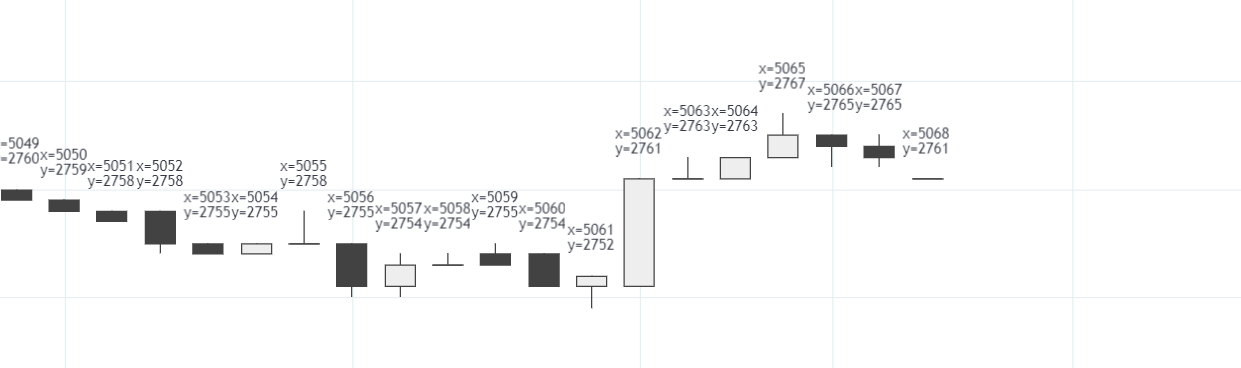
//@version=4
label.new( bar_index ,high ,"x="+tostring(bar_index)+"\ny="+tostring(high) ,style=label.style_none )timeで位置を指定することができます。
//@version=4
dt = time - time[1]
var label xy = na
label.delete( xy )
xy := label.new( time+3 * dt ,hlc3 ,"x="+tostring(bar_index)+"\ny="+tostring(high) ,xloc.bar_time ,style=label.style_none )table.new()を使って
plotshapeやlabelはローソク足に対して情報を表示しますが、tableはチャートウィンドウに情報を配置することができます。
この記事の中の相関係数一覧表でも、tableで情報を表示しています。
その他
複数のシグナルを表示

//@version=3

a = ema(close ,5)
b = ema(close ,25)
c = ema(close ,50)

sig1 = cross(a ,b)
sig2 = cross(a ,c)
sig3 = cross(b ,c)

p1 = plot(4 ,color=black ,editable=false ,trackprice=false)
p2 = plot(3 ,color=black ,editable=false ,trackprice=false)
p3 = plot(2 ,color=black ,editable=false ,trackprice=false)
p4 = plot(1 ,color=black ,editable=false ,trackprice=false)

fill(p1 ,p2 ,color = sig1 ? red : gray ,title="sig1" ,transp=50)
fill(p2 ,p3 ,color = sig2 ? red : gray ,title="sig2" ,transp=50)
fill(p3 ,p4 ,color = sig3 ? red : gray ,title="sig3" ,transp=50)
直近のデータだけ描画
他にも、plot plotbar plotchar fillなどでもshow_lastを使うことができる。
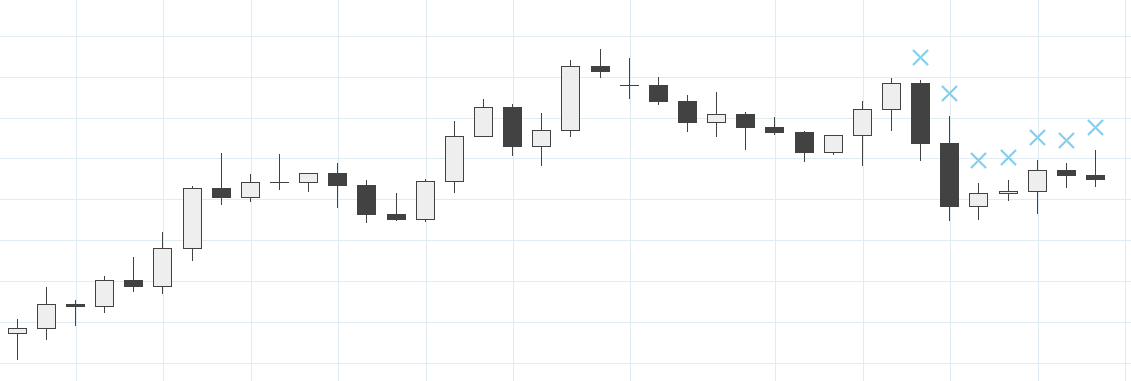
plotshape(close, show_last=7)前々回の安値・高値更新を元にしたトレイリングストップ
//@version=3
vw_low  = valuewhen(low  > low[1]  ,low[1]  ,1)
vw_high = valuewhen(high < high[1] ,high[1] ,1)
low_active  = close > vw_low
high_active = close < vw_high
p1 = plot(low_active  ? vw_low  : na ,linewidth=1 ,color=purple ,style=linebr ,title="前々回の安値更新")
p2 = plot(high_active ? vw_high : na ,linewidth=1 ,color=purple ,style=linebr ,title="前々回の高値更新")
数秘を算出
「Astrology(占星)が有効なら、Numerology(数秘)も有効なんじゃないか」と、ちょっと気になって作成してみたコード。実用性はあまりなさそう。サクッと試せるのはTradingViewの良いところ。
calc_n(target) =>
    n4  = target >= 2000 ? 2 : target >= 1000 ? 1 : 0
    n3_ = target - n4*1000
    n3  = n3_ >= 900 ? 9 : n3_ >= 800 ? 8 : n3_ >= 700 ? 7 : n3_ >= 600 ? 6 : n3_ >= 500 ? 5 : n3_ >= 400 ? 4 : n3_ >= 300 ? 3 : n3_ >= 200 ? 2 : n3_ >= 100 ? 1 : 0
    n2_ = n3_ - n3*100
    n2  = n2_ >= 90 ? 9 : n2_ >= 80 ? 8 : n2_ >= 70 ? 7 : n2_ >= 60 ? 6 : n2_ >= 50 ? 5 : n2_ >= 40 ? 4 : n2_ >= 30 ? 3 : n2_ >= 20 ? 2 : n2_ >= 10 ? 1 : 0
    n1  = n2_ - n2*10
    [n4 ,n3 ,n2 ,n1]

[y4 ,y3 ,y2 ,y1] = calc_n(year)
[_ ,_ ,m2 ,m1]   = calc_n(month)
[_ ,_ ,d2 ,d1]   = calc_n(dayofmonth)
num__ = y4 + y3 + y2 + y1 + m2 + m1 + d2 + d1

[_ ,_ ,n2_ ,n1_] = calc_n(num__)
num_ = n2_ + n1_

[_ ,_ ,n2 ,n1] = calc_n(num_)
num = n2 + n1
変化率の対数を算出
roc()が変化率。1%を、0.01ではなく1と返すため、100で割っている。log()は対数を返す。これを必要なだけ足していくと Ku-Chart ができあがる。
calc_log(target) => nz( log( 1 + roc(target ,1) / 100 ))強弱の順位を算出
同程度の数値があって順位が欲しい場合に使う。
target1 = __YOUR_PROGRAM__
target2 = __YOUR_PROGRAM__
target3 = __YOUR_PROGRAM__
target4 = __YOUR_PROGRAM__
target5 = __YOUR_PROGRAM__
target6 = __YOUR_PROGRAM__
target7 = __YOUR_PROGRAM__
target8 = __YOUR_PROGRAM__

rank(target) =>
    _1 = target > target1 ? 0 : 1
    _2 = target > target2 ? 0 : 1
    _3 = target > target3 ? 0 : 1
    _4 = target > target4 ? 0 : 1
    _5 = target > target5 ? 0 : 1
    _6 = target > target6 ? 0 : 1
    _7 = target > target7 ? 0 : 1
    _8 = target > target8 ? 0 : 1
    _1 + _2 + _3 + _4 + _5 + _6 + _7 + _8

rank1 = rank(target1)
VWAPの累積平均を算出
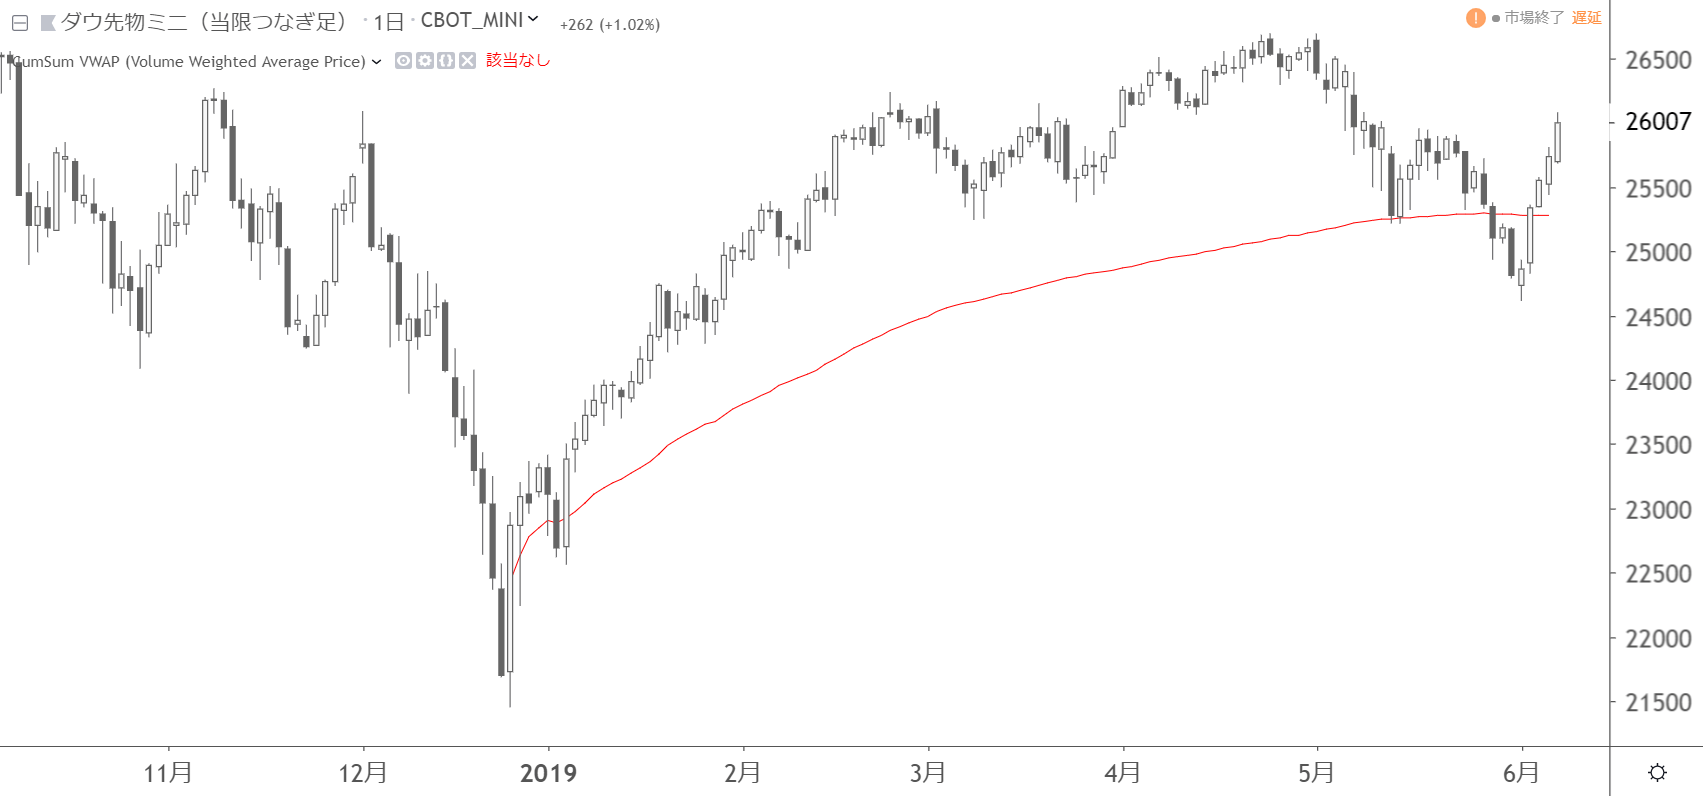
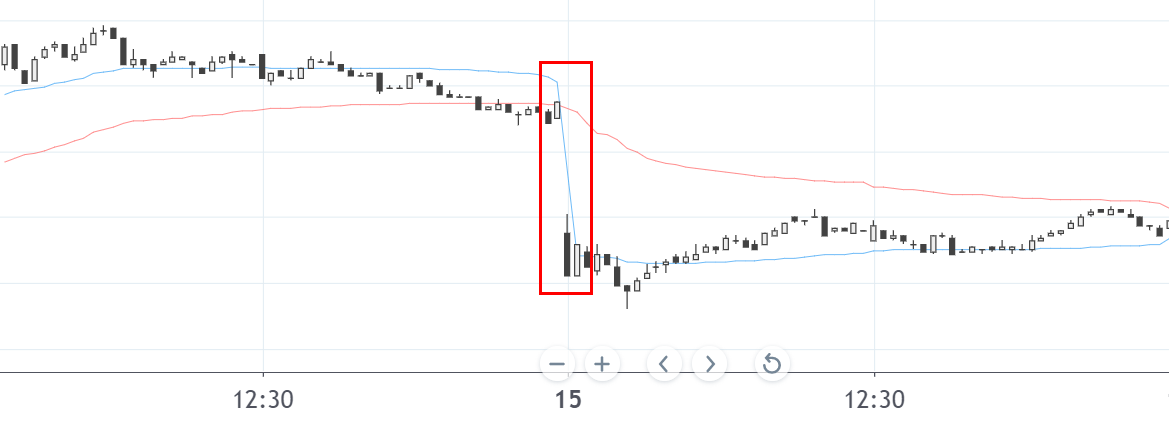
VWAPというのは、「Volume Weighted Average Price(出来高加重平均価格)」のこと。多くの機関投資家が参考にするものらしく、このラインよりも価格が上にあれば、起点とする日より後に買った投資家の損益合計はプラスになるとのこと。VWAP の移動平均はvwma()という関数が用意されている。
isWork = timestamp( fromY ,fromM ,fromD ,00 ,00 ) <= time

volume_sum = volume
volume_sum := isWork ? isWork[1] != isWork ? volume : volume_sum[1] + volume : 0

vwap_sum = vwap
vwap_sum := isWork ? isWork[1] != isWork ? vwap
         :  (vwap_sum[1] * volume_sum[1] + vwap * volume) / volume_sum
: na注意点
起点となる足のvwapをnaなどで削ると正確に計算されない。想像するに、vwapは組み込み変数のようで、ウラは関数。以下のコードは上手くいかない。
//@version=4

dayOpen = security( syminfo.tickerid ,"D" ,open ,lookahead=barmerge.lookahead_on )
is_open = dayOpen[1]!=dayOpen

plot( is_open ? na : vwap ,color=color.red )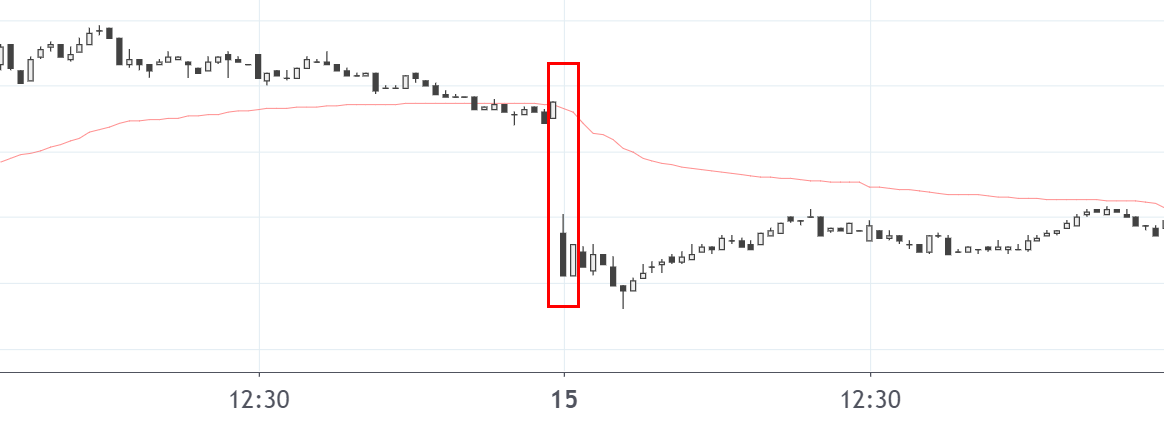
次のようにすると上手くいく。
//@version=4

dayOpen = security( syminfo.tickerid ,"D" ,open ,lookahead=barmerge.lookahead_on )
is_open = dayOpen[1]!=dayOpen

VWAP = vwap

plot( is_open ? na : VWAP ,color=color.blue )
表示しているチャートの右端、左端を取得
チャートウインドウで見えている範囲の左端や右端のtimeを取得できます。いつの間にか増えてました。やや処理が重たい印象です。
表示範囲に限定して分析を行うのに便利です。
Pineスクリプト™ マニュアル - chart.left_visible_bar_time()
jp.tradingview.com
Pineスクリプト™ マニュアル - chart.right_visible_bar_time()
jp.tradingview.com
インジケーターの計算期間を可変にする
通常、組み込み関数で用意されているテクニカル指標は計算期間を動的に変化させることができません。
計算期間を動的に変化させたい場合は、テクニカル指標を算出する関数を自作します。以下はRSIの例です。
//@version=5

calc_rsi_cutler( x, y ) =>
    avg_up   = 0.0
    avg_down = 0.0
    for i = 0 to y - 1
        avg_up   += math.max( x[i] - x[i + 1], 0 ) / y
        avg_down += math.max( x[i + 1] - x[i], 0 ) / y
    rs = avg_up / avg_down
    100 - ( 100 / ( rs + 1 ) )
大抵の組み込み関数は、ドキュメントを見ると元となるコードが掲載されていますし、TradingView公式のインジケーターはコードを閲覧することができます。これらを流用することで、わりと簡単に作成することができます。
ただし、元となるコードの中にもta系の組み込み関数が使われていることがあり、そういうものは不具合が生じることが多いです。特に、ta.ema()のような、前のデータを閲覧しながら計算するような組み込み関数に、計算期間を動的に変化させるのに不都合な結果が多く見られます。
2つのZigzag
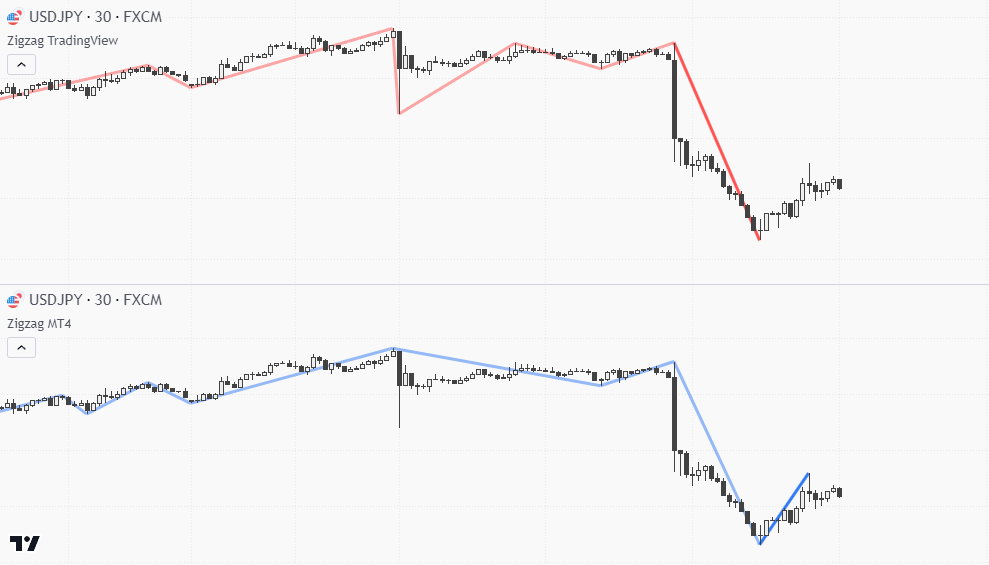
同じZigzagでも、TradingViewとMT4ではややロジックが異なります。
TradingView版は頂点の検出に、頂点の候補と前後を比較する方法をとります。例えば、期間を12と設定すると、あるローソク足から6本ずつ前後を確認しその足が最も高い(安い)ことを確認します。転換率は前回の変動に対するパーセントで確認します。
//@version=5
indicator( "Zigzag TradingView", overlay=true )

////
// 設定
//
GRP1 = "ZigZag"
zz_depth     = input.int( 12, "Depth(期間)", minval=1, group=GRP1 )
zz_deviation = input.float( .1, "Deviation(転換率)", minval=.01, maxval=100, group=GRP1 )
zz_color     = input.color( color.red, "ラインの色", group=GRP1, inline="0" )
zz_num_of    = input.int( 1, "ターゲット", minval=0, maxval=10, group=GRP1 )
zz_transp    = input.int( 75, "ターゲット以外のラインの透明度", minval=0, maxval=100, group=GRP1 )
zz_linestyle = line.style_solid
zz_linewidth = 3

////
// zigzag
// TradingView版のZigZagに合わせたもの
//
get_all_pivots( src, length, isHigh ) => // 異なる点1-1
    target = nz( src[ length ] )
    if length == 0
        [ bar_index, target ]
    else
        isFound = true
        for i = 0 to length - 1
            if isHigh and src[i] > target
                isFound := false
            if not isHigh and src[i] < target
                isFound := false
        for i = length + 1 to 2 * length
            if isHigh and src[i] >= target
                isFound := false
            if not isHigh and src[i] <= target
                isFound := false
        if isFound and 2 * length <= bar_index
            [ bar_index[ length ], target ]
        else
            [ int(na), float(na) ]

pivot_length = math.floor( zz_depth / 2 ) // 異なる点1-2
[ iH, pH ] = get_all_pivots( high, pivot_length, true )
[ iL, pL ] = get_all_pivots( low, pivot_length, false )

calc_dev( base_price, price ) => // 異なる点2
    100 * ( price - base_price ) / base_price

var arr_lines      = array.new_line( 10, na )
var arr_zz_index   = array.new_int( 11, na )
var arr_zz_price   = array.new_float( 11, na )
var arr_zz_isHigh  = array.new_bool( 10, na )
var int linesCount = 0
var color zz_color_transp100 = color.new( zz_color, zz_transp )

get_and_draw_zigzag( dev, isHigh, index, price ) =>
    lineLast   = array.get( arr_lines, 0 )
    iLast      = array.get( arr_zz_index, 0 )
    pLast      = array.get( arr_zz_price, 0 )
    isHighLast = array.get( arr_zz_isHigh, 0 )
    if isHighLast == isHigh and not na( lineLast )
        if isHighLast ? price > pLast : price < pLast
            if linesCount <= 1
                line.set_xy1( lineLast, index, price )
            line.set_xy2( lineLast, index, price )
            [ lineLast, isHighLast, false ]
        else
            [ line( na ), bool( na ), false ]
    else
        if na( lineLast )
            id = line.new( index, price, index, price, color=zz_color_transp100, width=zz_linewidth, style=zz_linestyle )
            [ id, isHigh, true ]
        else
            // 異なる点3
            if math.abs( dev ) >= zz_deviation
                id = line.new( iLast, pLast, index, price, color=zz_color_transp100, width=zz_linewidth, style=zz_linestyle )
                [ id, isHigh, true ]
            else
                [ line( na ), bool( na ), false ]

add_for_arr_lines( new_line_id ) =>
    target_index = zz_num_of - 1
    line.set_color( array.get( arr_lines, target_index ), zz_color_transp100 )
    array.unshift( arr_lines, new_line_id )
    array.pop( arr_lines )
    line.set_color( array.get( arr_lines, target_index ), zz_color )

add_for_arr( target_array, new_value ) =>
    array.unshift( target_array, new_value )
    array.pop( target_array )

if not na( iH ) and not na( iL ) and iH == iL
    dev1 = calc_dev( array.get( arr_zz_price, 0 ), pH )
    [ id2, isHigh2, isNew2 ] = get_and_draw_zigzag( dev1, true, iH, pH )
    if isNew2
        add_for_arr_lines( id2 )
        add_for_arr( arr_zz_index, iH )
        add_for_arr( arr_zz_price, pH )
        add_for_arr( arr_zz_isHigh, isHigh2 )
        linesCount += 1
    else if not na( id2 )
        array.set( arr_zz_index, 0, iH )
        array.set( arr_zz_price, 0, pH )
    dev2 = calc_dev( array.get( arr_zz_price, 0 ), pL )
    [ id1, isHigh1, isNew1 ] = get_and_draw_zigzag( dev2, false, iL, pL )
    if isNew1
        add_for_arr_lines( id1 )
        add_for_arr( arr_zz_index, iL )
        add_for_arr( arr_zz_price, pL )
        add_for_arr( arr_zz_isHigh, isHigh1 )
        linesCount += 1
    else if not na( id1 )
        array.set( arr_zz_index, 0, iL )
        array.set( arr_zz_price, 0, pL )
else
    if not na( iH )
        dev1 = calc_dev( array.get( arr_zz_price, 0 ), pH )
        [ id, isHigh, isNew ] = get_and_draw_zigzag( dev1, true, iH, pH )
        if isNew
            add_for_arr_lines( id )
            add_for_arr( arr_zz_index, iH )
            add_for_arr( arr_zz_price, pH )
            add_for_arr( arr_zz_isHigh, isHigh )
            linesCount += 1
        if not na( id )
            array.set( arr_zz_index, 0, iH )
            array.set( arr_zz_price, 0, pH )
    else
        if not na( iL )
            dev2 = calc_dev( array.get( arr_zz_price, 0 ), pL )
            [ id, isHigh, isNew ] = get_and_draw_zigzag( dev2, false, iL, pL )
            if isNew
                add_for_arr_lines( id )
                add_for_arr( arr_zz_index, iL )
                add_for_arr( arr_zz_price, pL )
                add_for_arr( arr_zz_isHigh, isHigh )
                linesCount += 1
            if not na( id )
                array.set( arr_zz_index, 0, iL )
                array.set( arr_zz_price, 0, pL )
一方、MT4のものは、あるローソク足が最も高い(安い)ことを確認します。常に過去だけと比較します。Deviationは転換【率】ではなくティック数の比較で、TradingView版にはないBackStepという項目があります。
//@version=5
indicator( "Zigzag MT4", overlay=true )

////
// 設定
//
GRP1 = "ZigZag"
zz_depth     = input.int( 12, "Depth", minval=1, group=GRP1 )
zz_deviation = input.float( 5, "Deviation", minval=.01, maxval=100, group=GRP1 )
zz_back_step = input.int( 3, "BackStep(反転の最小期間)", minval=0, group=GRP1 )
zz_color     = input.color( color.red, "ラインの色", group=GRP1, inline="0" )
zz_num_of    = input.int( 1, "ターゲット", minval=0, maxval=10, group=GRP1 )
zz_transp    = input.int( 75, "ターゲット以外のラインの透明度", minval=0, maxval=100, group=GRP1 )
zz_linestyle = line.style_solid
zz_linewidth = 3

////
// zigzag
// MT4版のZigZagに合わせたもの
//
get_extremum( src, length, isHigh ) => // 異なる点1
    target = src[ 0 ]
    if length == 0
        [ bar_index, target ]
    else
        isFound = true
        for i = 0 to length - 1
            if isHigh and src[i] > target
                isFound := false
            if not isHigh and src[i] < target
                isFound := false
        if isFound and length <= bar_index
            [ bar_index, target ]
        else
            [ int(na), float(na) ]

[ iH, pH ] = get_extremum( high, zz_depth, true )
[ iL, pL ] = get_extremum( low, zz_depth, false )

calc_dev( base_price, price, isHigh ) =>  // 異なる点2
    if isHigh
        price - base_price
    else
        base_price - price

var arr_lines      = array.new_line( 10, na )
var arr_zz_index   = array.new_int( 11, na )
var arr_zz_price   = array.new_float( 11, na )
var arr_zz_isHigh  = array.new_bool( 10, na )
var int linesCount = 0
var color zz_color_transp100 = color.new( zz_color, zz_transp )

get_and_draw_zigzag( dev, isHigh, index, price ) =>
    lineLast   = array.get( arr_lines, 0 )
    iLast      = array.get( arr_zz_index, 0 )
    pLast      = array.get( arr_zz_price, 0 )
    isHighLast = array.get( arr_zz_isHigh, 0 )
    if isHighLast == isHigh and not na( lineLast )
        if isHighLast ? price > pLast : price < pLast
            if linesCount <= 1
                line.set_xy1( lineLast, index, price )
            line.set_xy2( lineLast, index, price )
            [ lineLast, isHighLast, false ]
        else
            [ line( na ), bool( na ), false ]
    else
        if na( lineLast )
            id = line.new( index, price, index, price, color=zz_color_transp100, width=zz_linewidth, style=zz_linestyle )
            [ id, isHigh, true ]
        else
            // 異なる点3 : 偏差の基準はティックにする(MT4版のdeviationは機能してなさそう)
            if math.abs( dev ) >= zz_deviation * syminfo.mintick and bar_index - iLast >= zz_back_step
                id = line.new( iLast, pLast, index, price, color=zz_color_transp100, width=zz_linewidth, style=zz_linestyle )
                [ id, isHigh, true ]
            else
                [ line( na ), bool( na ), false ]

add_for_arr_lines( new_line_id ) =>
    target_index = zz_num_of - 1
    line.set_color( array.get( arr_lines, target_index ), zz_color_transp100 )
    array.unshift( arr_lines, new_line_id )
    array.pop( arr_lines )
    line.set_color( array.get( arr_lines, target_index ), zz_color )

add_for_arr( target_array, new_value ) =>
    array.unshift( target_array, new_value )
    array.pop( target_array )

if not na( iH ) and not na( iL ) and iH == iL
    dev1 = calc_dev( array.get( arr_zz_price, 0 ), pH, true )
    [ id2, isHigh2, isNew2 ] = get_and_draw_zigzag( dev1, true, iH, pH )
    if isNew2
        add_for_arr_lines( id2 )
        add_for_arr( arr_zz_index, iH )
        add_for_arr( arr_zz_price, pH )
        add_for_arr( arr_zz_isHigh, isHigh2 )
        linesCount += 1
    else if not na( id2 )
        array.set( arr_zz_index, 0, iH )
        array.set( arr_zz_price, 0, pH )
    dev2 = calc_dev( array.get( arr_zz_price, 0 ), pL, false )
    [ id1, isHigh1, isNew1 ] = get_and_draw_zigzag( dev2, false, iL, pL )
    if isNew1
        add_for_arr_lines( id1 )
        add_for_arr( arr_zz_index, iL )
        add_for_arr( arr_zz_price, pL )
        add_for_arr( arr_zz_isHigh, isHigh1 )
        linesCount += 1
    else if not na( id1 )
        array.set( arr_zz_index, 0, iL )
        array.set( arr_zz_price, 0, pL )
else
    if not na( iH )
        dev1 = calc_dev( array.get( arr_zz_price, 0 ), pH, true )
        [ id, isHigh, isNew ] = get_and_draw_zigzag( dev1, true, iH, pH )
        if isNew
            add_for_arr_lines( id )
            add_for_arr( arr_zz_index, iH )
            add_for_arr( arr_zz_price, pH )
            add_for_arr( arr_zz_isHigh, isHigh )
            linesCount += 1
        if not na( id )
            array.set( arr_zz_index, 0, iH )
            array.set( arr_zz_price, 0, pH )
    else
        if not na( iL )
            dev2 = calc_dev( array.get( arr_zz_price, 0 ), pL, false )
            [ id, isHigh, isNew ] = get_and_draw_zigzag( dev2, false, iL, pL )
            if isNew
                add_for_arr_lines( id )
                add_for_arr( arr_zz_index, iL )
                add_for_arr( arr_zz_price, pL )
                add_for_arr( arr_zz_isHigh, isHigh )
                linesCount += 1
            if not na( id )
                array.set( arr_zz_index, 0, iL )
                array.set( arr_zz_price, 0, pL )
TradingViewのものはローソク足の前後を確認する分やや反応が遅れまが、頂点の検出方法としては合理的だと考えています。
デバック
plot()を使って
確認したい値が「数値」の場合は、plot()でデバックする。なんか上手くいっていないときは、とにかくまずplot()。
label.new()を使って
確認したい項目が「文字列」の場合は、label.new()で確認する。
//@version=4
study("マイスクリプト" ,overlay=true )

dayOpen = security( syminfo.tickerid ,"D" ,open ,lookahead=barmerge.lookahead_on )
is_open = dayOpen[1]!=dayOpen

if( is_open )
label.new( bar_index ,high+tr/2 ,syminfo.timezone ,style=label.style_none )tostring()を組み合わせて数値を確認することもできる。
//@version=4
study("マイスクリプト" ,overlay=true )

dayOpen = security( syminfo.tickerid ,"D" ,open ,lookahead=barmerge.lookahead_on )
is_open = dayOpen[1]!=dayOpen

if( is_open )
    label.new( bar_index ,high+tr/2 ,tostrign( open ) ,style=label.style_none )
開発を承っています
- Pineスクリプト(インジケーターやストラテジー)
- Google Apps Script
- Python
- MQL4
などの開発を承っています。とくに投資関連が得意です。過去の事例は「実績ページ(不定期更新)」でご確認ください。ご相談は「お問い合わせ」からお願いします。


- 記事をシェア