

どんな記事
TradingView(トレーディングビュー)の Pineスクリプトでつくる「Strategy(バックテスト)」の、よく使う組み合わせをまとめてみました(主に自分用)。どれもコピペで機能をつけ加えることができる簡単なものです。
今後も、新たに見つけたり思いついたものがあれば、ここに加えていく予定です!
追記
2019年5月4日
「複数の損切りや増し玉、チャートにラインも引く」「タートルズの資金管理」のコードを最新のものに更新しました。
共通のコード
この記事でご紹介するコードのStrategy()は、すべて次のようにしています。
※ Strategy()は、TradingViewのバックテストのプログラムにおいて、必ず最初に記述しなければならない関数です。
//@version=3
strategy("___TITLE___"
  , default_qty_type = strategy.fixed
  , default_qty_value = 1
  , pyramiding = 4
, overlay = true )シンプルな手法の成果をみたい場合は、default_qty_type = strategy.fixed default_qty_value = 1とすることで「値幅を基準にした成績」を得ることができます。また、ピラミッティングはタートルズと同じく最大4ユニットまでしか行わないため、pyramiding = 4としています。
また、__YOUR_PROGRAM__には任意のコードを入れます。
バックテストの期間を指定する
デフォルトでは全期間(TradingView基準)で行われるバックテストの期間を、区切る(指定する)ことができるようになります。
fromYear = input(2017 ,type=integer ,minval=1900 ,title="test start")
endYear  = input(2018 ,type=integer ,minval=1900 ,title="test end")
isWork   = timestamp(fromYear ,1 ,1 ,00 ,00) <= time and time < timestamp(endYear+1 ,1 ,1 ,00 ,00)
posi     = strategy.position_size != 0

L_EntrySig = isWork and __YOUR_PROGRAM__
S_EntrySig = isWork and __YOUR_PROGRAM__

if(posi)
    L_ExitSig = __YOUR_PROGRAM__
    S_ExitSig = __YOUR_PROGRAM__
    strategy.close_all(when = L_ExitSig or S_ExitSig or not isWork)

if(L_EntrySig)
    strategy.entry("L-Entry" ,strategy.long ,comment="L-Entry1")

if(S_EntrySig)
    strategy.entry("S-Entry" ,strategy.short ,comment="S-Entry1")

bgcolor(color
  = not isWork ? #aaaaaa
  : na
  ,transp=70 ,title="背景色")
取引日数を数える
取引日数に関連したスキームを作成する場合につかいます。
countTradingDays = na
countNonTradingDays = na
countTradingDays := not posi ? 0 : countTradingDays[1] + 1
countNonTradingDays := posi ? 0 : countNonTradingDays[1] + 1
// plot(countTradingDays ,transp=0 ,title="取引日数")
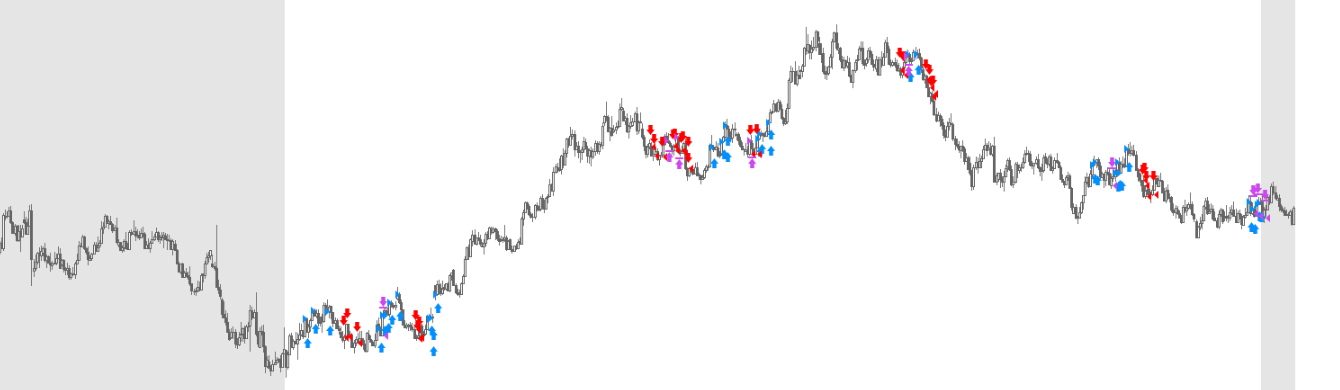
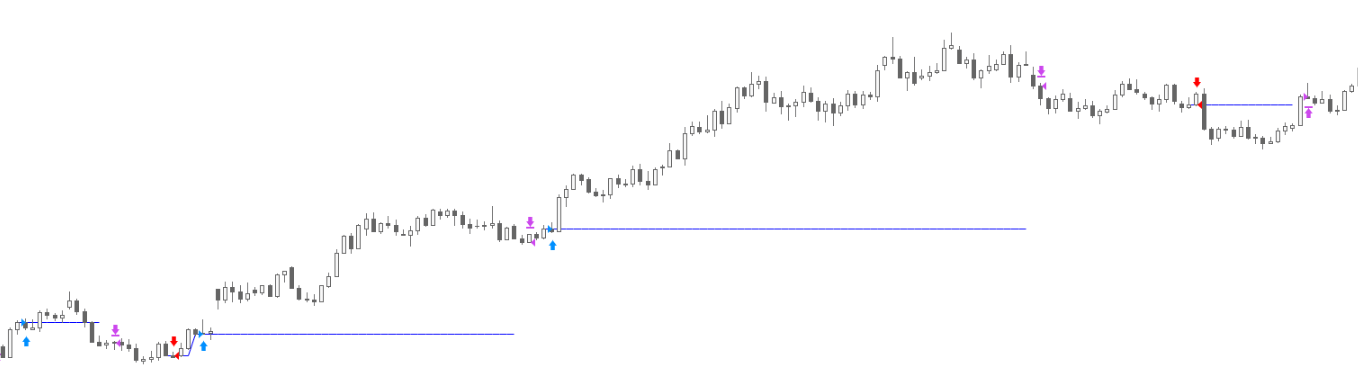
// plot(countNonTradingDays ,transp=0 ,title="ノンポジ日数")エントリーした価格にラインを引く
「どこで利益が発生したのか」が、より分かりやすくなります。
posi_l = strategy.position_size > 0
posi_s = strategy.position_size < 0
posi   = strategy.position_size != 0

entry1  = close
entry1 := not posi ? na : L_EntrySig[1] or S_EntrySig[1] ? open : entry1[1]

L_EntrySig = __YOUR_PROGRAM__
S_EntrySig = __YOUR_PROGRAM__

if(L_EntrySig)
      strategy.entry("L-Entry1" ,strategy.long ,comment="L-Entry1")

if(S_EntrySig)
      strategy.entry("S-Entry1" ,strategy.short ,comment="S-Entry1")

plot(entry1 ,title="entry1" ,color=blue ,transp=0 ,style=linebr)
複数の損切りや増し玉、チャートにラインも引く
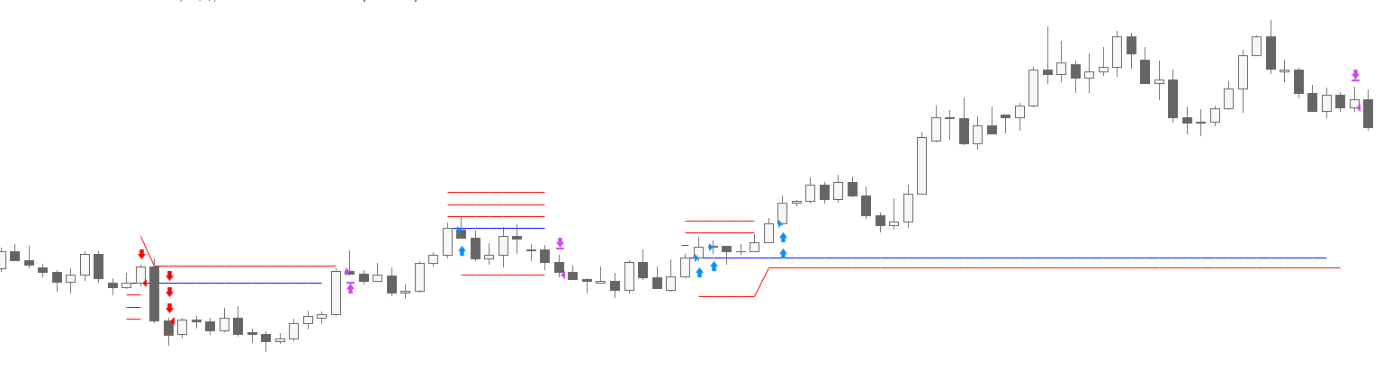
MAX_N   = input(4    ,type=integer ,minval=1 ,maxval=4 ,title="maximun num of unit")
SO_bool = input(true ,title="loss cut")

posi_l = strategy.position_size > 0
posi_s = strategy.position_size < 0
posi   = strategy.position_size != 0

entry1   = close
entry2   = close
entry3   = close
entry4   = close
entry1  := not posi ? na : entry1[1]
entry2  := not posi ? na : entry2[1]
entry3  := not posi ? na : entry3[1]
entry4  := not posi ? na : entry4[1]

lo2      = close
lo3      = close
lo4      = close
lo2     := not posi ? na : lo2[1]
lo3     := not posi ? na : lo3[1]
lo4     := not posi ? na : lo4[1]

L_EntrySig = __YOUR_PROGRAM__
S_EntrySig = __YOUR_PROGRAM__

lo_sig2 = posi_l ? lo2 < high : posi_s ? lo2 > low : na
lo_sig3 = posi_l ? lo3 < high : posi_s ? lo3 > low : na
lo_sig4 = posi_l ? lo4 < high : posi_s ? lo4 > low : na

losscut   = close
losscut  := L_EntrySig ? __YOUR_PROGRAM__
         :  S_EntrySig ? __YOUR_PROGRAM__
         :  lo_sig4 ? posi_l ? __YOUR_PROGRAM__ : __YOUR_PROGRAM__
         :  lo_sig3 ? posi_l ? __YOUR_PROGRAM__ : __YOUR_PROGRAM__
         :  lo_sig2 ? posi_l ? __YOUR_PROGRAM__ : __YOUR_PROGRAM__
         :  posi ? losscut[1]
         :  na

ExitPrice  = close
ExitPrice := L_EntrySig or posi_l ? losscut
          :  S_EntrySig or posi_s ? losscut
          :  na

TargetPrice   = close
TargetPrice  := L_EntrySig ? __YOUR_PROGRAM__
             :  S_EntrySig ? __YOUR_PROGRAM__
             :  posi ? TargetPrice[1]
             :  na

if(posi)
    L_ExitSig = S_EntrySig and posi_l
    S_ExitSig = L_EntrySig and posi_s

    if(L_ExitSig or S_ExitSig or not isWork)
        strategy.cancel_all()
        strategy.close_all()

    strategy.exit("stop-L1" ,"L1" ,limit=TargetPrice ,stop=ExitPrice ,comment="stop-L1")
    strategy.exit("stop-L2" ,"L2" ,limit=TargetPrice ,stop=ExitPrice ,comment="stop-L2")
    strategy.exit("stop-L3" ,"L3" ,limit=TargetPrice ,stop=ExitPrice ,comment="stop-L3")
    strategy.exit("stop-L4" ,"L4" ,limit=TargetPrice ,stop=ExitPrice ,comment="stop-L4")

    strategy.exit("stop-S1" ,"S1" ,limit=TargetPrice ,stop=ExitPrice ,comment="stop-S1")
    strategy.exit("stop-S2" ,"S2" ,limit=TargetPrice ,stop=ExitPrice ,comment="stop-S2")
    strategy.exit("stop-S3" ,"S3" ,limit=TargetPrice ,stop=ExitPrice ,comment="stop-S3")
    strategy.exit("stop-S4" ,"S4" ,limit=TargetPrice ,stop=ExitPrice ,comment="stop-S4")

    if(lo_sig2 and MAX_N >= 2)
        entry2 := lo2
        lo2 := na
    if(lo_sig3 and MAX_N >= 3)
        entry3 := lo3
        lo3 := na
    if(lo_sig4 and MAX_N >= 4)
        entry4 := lo4
        lo4 := na

if(not posi)
    strategy.cancel_all()

if(L_EntrySig)
    entry1 := close

    strategy.entry("L1" ,strategy.long ,comment="Entry-L1")
    strategy.exit("stop-L1" ,"L1" ,limit=TargetPrice ,stop=ExitPrice ,comment="stop-L1")

    if(MAX_N >= 2)
        lo2 := __YOUR_PROGRAM__
        strategy.entry("L2" ,strategy.long ,stop=lo2 ,comment="Entry-L2")
    if(MAX_N >= 3)
        lo3 := __YOUR_PROGRAM__
        strategy.entry("L3" ,strategy.long ,stop=lo3 ,comment="Entry-L3")
    if(MAX_N >= 4)
        lo4 := __YOUR_PROGRAM__
        strategy.entry("L4" ,strategy.long ,stop=lo4 ,comment="Entry-L4")

if(S_EntrySig)
    entry1 := close

    strategy.entry("S1" ,strategy.short ,comment="Entry-S1")
    strategy.exit("stop-S1" ,"S1" ,limit=TargetPrice ,stop=ExitPrice ,comment="stop-S1")

    if(MAX_N >= 2)
        lo2 := __YOUR_PROGRAM__
        strategy.entry("S2" ,strategy.short ,stop=lo2 ,comment="Entry-S2")
    if(MAX_N >= 3)
        lo3 := __YOUR_PROGRAM__
        strategy.entry("S3" ,strategy.short ,stop=lo3 ,comment="Entry-S3")
    if(MAX_N >= 4)
        lo4 := __YOUR_PROGRAM__
        strategy.entry("S4" ,strategy.short ,stop=lo4 ,comment="Entry-S4")


plot(entry1  ,title="entry1"  ,color=blue ,transp=0 ,style=linebr)
plot(lo2     ,title="lo2"     ,color=red  ,transp=0 ,style=linebr)
plot(lo3     ,title="lo3"     ,color=red  ,transp=0 ,style=linebr)
plot(lo4     ,title="lo4"     ,color=red  ,transp=0 ,style=linebr)
plot(losscut ,title="losscut" ,color=red  ,transp=0 ,style=linebr)
strategy.entry("L1" ,strategy.long)とstrategy.exit("stop-L1" ,"L1" ,limit=TargetPrice ,stop=ExitPrice)の"L1"が注文IDで、紐付いている。
タートルズの資金管理
タートルズの資金管理をさまざまな角度から検証できるようになります。
- タートルズの資金管理の有無
- 単利か、タートルズの複利か
- 未決済の損益を含めるか
- 年ごとの複利
勝率は難しいですが、資金管理を行うことでRR比を改善 することができます。「値幅のRR比」と「損益のRR比」の違いによるものです。この検証をTradingViewで気軽に行うことができるのは非常にありがたい。
cash_bool = input(true ,title="amount management")
manage_op = input("turtle compound" ,title="amount management type" ,options=["turtle compound" ,"simple"])
incl_open = input(true ,title="unit calc include open profit")
y_reset   = input(true ,title="yearly DD reset")
lot       = input(100  ,title="lot" ,minval=1)
currency  = input("None" ,title="currency" ,options=["None" ,"USD" ,"EUR" ,"GBP" ,"AUD" ,"CAD" ,"CHF"])

atr = ema(tr ,20)

sc1(currency) =>
     currency=="None" ? 1 :
     currency=="USD" ? security("usdjpy" ,"D" ,close)[1] :
     currency=="EUR" ? security("eurjpy" ,"D" ,close)[1] :
     currency=="GBP" ? security("gbpjpy" ,"D" ,close)[1] :
     currency=="AUD" ? security("audjpy" ,"D" ,close)[1] :
     currency=="CAD" ? security("cadjpy" ,"D" ,close)[1] :
     currency=="CHF" ? security("chfjpy" ,"D" ,close)[1] :
     na

balance = strategy.initial_capital + strategy.netprofit
maximum_balance   = na
maximum_balance  := y_reset and year > year[1] ? balance
                 :  balance > nz(maximum_balance[1]) ? balance : nz(maximum_balance[1])

unit_source  = incl_open==false ? balance
             : balance + strategy.openprofit
maximum_source  = na
maximum_source := y_reset and year > year[1] ? unit_source
               :  unit_source > nz(maximum_source[1]) ? unit_source : nz(maximum_source[1])

dd = maximum_source - unit_source
unit_value = manage_op=="turtle compound" and dd==0 ? unit_source / 100
           : manage_op=="turtle compound" and dd > 0 ? (maximum_source - dd * 2) / 100
           : strategy.initial_capital / 100

amount  = na
amount := cash_bool ? round(unit_value / (atr * sc1(currency)) / lot) * lot : na

posi_l = strategy.position_size > 0
posi_s = strategy.position_size < 0
posi   = strategy.position_size != 0

L_EntrySig = __YOUR_PROGRAM__
S_EntrySig = __YOUR_PROGRAM__

if(posi)
    L_ExitSig = __YOUR_PROGRAM__
    S_ExitSig = __YOUR_PROGRAM__

    if(L_ExitSig or S_ExitSig or not isWork)
        strategy.cancel_all()
        strategy.close_all()

if(L_EntrySig)
    strategy.entry("L1" ,strategy.long ,qty=amount ,comment="Entry-L1")

if(S_EntrySig)
    strategy.entry("S1" ,strategy.short ,qty=amount ,comment="Entry-S1")


// 以下のplotを入れることで、チャート上に資産の増減を描画することもできます

//a=plot(balance ,transp=0 ,title="決済済みの残高" ,color=gray)
//plot(maximum_balance ,transp=0 ,title="決済済み最高残高" ,color=blue ,transp=0)
//plot(strategy.initial_capital ,transp=0 ,title="元金" ,color=black ,transp=0)
//b=plot(0 ,title="zero" ,color=black)
//fill(a,b,color=blue)
開発を承っています
- Pineスクリプト(インジケーターやストラテジー)
- Google Apps Script
- Python
- MQL4
などの開発を承っています。とくに投資関連が得意です。過去の事例は「実績ページ(不定期更新)」でご確認ください。ご相談は「お問い合わせ」からお願いします。


- 記事をシェア